Menu
Enhanced Agricultural Management: A Deep Dive into METOS® Yield Prediction with Wolfgang Fuchs.
Smart Farming in Action – Validating METOS® Wheat Yield Prediction in Olds, Canada
Every season, farmers face the critical challenge of maximizing yield while minimizing waste. With METOS® Yield Prediction, they can now tackle this challenge head-on. This tool empowers producers to strategically plan fertilization, irrigation, and plant protection with unprecedented precision. It’s not just about cutting costs — it’s about leveraging smart data for smarter farming. By optimizing resource use, farmers don’t just boost their bottom line; they actively foster a healthier ecosystem and a more sustainable climate.
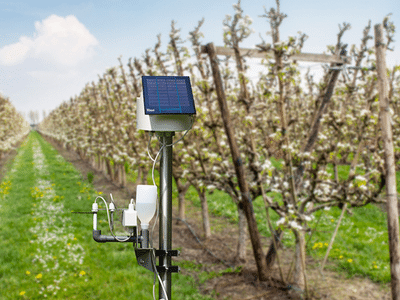
The METOS® Yield Prediction Solution equips growers with immediate and precise data on crop yield potential, directly reflecting water availability. Enhanced by an in-field METOS® weather station, it ensures predictions are not only swift but also exceptionally accurate.
See the METOS® difference in action, showcasing a rigorous field experiment in Alberta, Canada, that highlights the precision of our wheat yield predictions.


Validating METOS® Yield Prediction: The Olds College Field Experiment
In 2022, Olds College Centre for Innovation (OCCI) rigorously tested the METOS® Yield Prediction model through a detailed field experiment in Alberta, Canada. This study was designed to critically assess the tool’s accuracy in forecasting wheat yields (Fig 1).


Sowing, fertilization, and plant protection management were carried out following common agricultural practices in the region. Additionally, integrated tools for work planning and leveraging your station’s weather data offer further decision-making support.
Identified productivity zones, mapped using historical harvest data, guided the placement of in-field weather stations across three distinct areas (Fig 2). Throughout the 2022 growing season, comprehensive data were collected spanning soil and plant characteristics, climatic conditions, and crop yield determinants.
Optimizing Yield Prediction: Key Settings
Configuring the Yield Prediction tool is straightforward, requiring just a few initial settings to get started. For the most accurate results, specific conditions like soil texture and moisture levels are factored in. We delve into optimizing these settings for optimal yield forecasting in our Farm Weather Talk (#007).
Our simulation of wheat yields at the Olds trial field was tailored to reflect local conditions (Fig 3). We input the actual sowing date to align with the crop’s lifecycle, set the soil moisture to a typical level for the region’s soil profile, and chose a clay loam texture based on soil analyses. We fine-tuned the maturity date and yield settings to mirror regional averages, ensuring a realistic prediction.
- Sowing date: May 5th, 2022
- Initial soil moisture: normal (60%)
- Soil texture: clay loam
- Maturity date adjustment: moved the slider to match the observed date (August 31st, 2022)
- Yield adjustment: moved the slider to closely match the regional average of 77.5 bu/ac (2016-2021)
For the wheat yield trial in Olds, we input the actual sowing date of May 5th and harvest date of September 9th into the Yield Prediction tool. While the predicted harvest date is generally a secondary consideration, it serves as a backup in rare scenarios. Crucially, accurate replication of field conditions, such as the correct crop type and sowing date, is vital for reliable yield predictions.
To fine-tune the maturity date setting in our Yield Prediction tool, we used the actual observed date which was August 31st, 2022. This date, though somewhat later than usual, is considered reasonable for the area. For average yield fine-tuning, we incorporated online published data from the Agriculture Financial Service Corporation (AFSC) in Alberta, which showed a mean wheat yield of 77.5 bu/ac from 2016 to 2021.
Local agricultural experts, utilizing both historic AFSC data and research from Olds College, established 95 bu/ac as the ceiling for average yield predictions. This upper limit is only applied if the model’s forecast surpasses this figure, a situation not encountered in the 2022 season. For initial soil moisture—a crucial factor for accurate yield forecasting—we relied on official data from the Government of Alberta’s Agricultural Moisture Situation Update, setting it at a ‘normal’ level, approximately 60%. This percentage represents the actual available water content for a one-meter soil profile. Additionally, soil texture, determined through sample analysis, was identified as clay loam.
Results: Yield Map and Satellite NDVI
The yield map from the combine harvest (Fig 4) shows a large variation within the trial field.
The METOS® satellite imagery (Fig 5) reveals the NDVI (Normalized Difference Vegetation Index) values across the field, with lower readings aligning with the less productive southern/southeastern and northeastern sections as shown in the yield map (Fig 4). This correlation underscores the utility of satellite NDVI as an indicator of crop health and potential yield, demonstrating its value in precision agriculture.
Equipped with an on-site weather station, we captured precise rainfall measurements throughout the season. During the experiment, total rainfall reached 341 mm, surpassing the long-term Olds average by 10%, which stands at 309 mm. This deviation is a critical factor in assessing Yield Prediction’s adaptability to variable weather conditions.
Evaluating the Precision of METOS® Yield Prediction
The accuracy of crop yield prediction is intricately linked to weather patterns, predominantly rainfall. Given the inherent uncertainties in seasonal weather forecasts, the reliability of Yield Prediction can fluctuate, particularly early in the season when it relies more heavily on projected rainfall data rather than on direct measurements from weather stations.
METOS® Yield Prediction cleverly overcomes these weather-related challenges. We’ve teamed up with Meteoblue, a top weather forecast provider, to ensure our predictions are based on the best available data. We also recommend that growers install our physical weather stations right in their fields. This way, they get the most accurate weather readings possible, which is something a virtual station just can’t match.
As the season unfolds, our Yield Prediction smartly integrates actual weather data collected from the field, gradually reducing dependence on weather forecasts. This intelligent blending of forecast and real-time data ensures that the accuracy of our predictions improves with each passing day, leveraging the strengths of both weather forecasts and localized measurements.
Interested in more information?
Read how METOS® Yield Prediction is in comparison to the real observed yield, its reliability and broader implications of adopting METOS® solutions, in our new brochure. Please submit your contact information to receive our business brochure promptly.
Learn more.
Download the Smart Farming in Action brochure.


