
Blog
How can a farmer adjust important management decisions during the growing season? Here's a new installment in the Farm Weather Talk series by Guy Ash, METOS® Global Training Manager.
What’s My In-Season Yield Potential?
This is perhaps the most thought-provoking question at this time of year, as crops fill out and as the song by Luke Bryan goes, “rain is a good thing, it makes the grain (corn)”. In dryland agriculture, yield comes down to two important environmental factors: water supply and thermal development, with the water supply by far the most important variable. Of course, the proper field management techniques are critical (fertility, weeds, disease, and insect management), but if you don’t have good environmental conditions all the field management may be for nothing.
Below is a field/crop zone that has been set up to look at yield potential based on the METOS® Yield Prediction Solution. As you can see from the image, the crop is canola and it is in full bloom as of July 20, 2023. Conditions for seeding were delayed due to cool temperatures and wet soil and as a result, flowering is a little later this year.
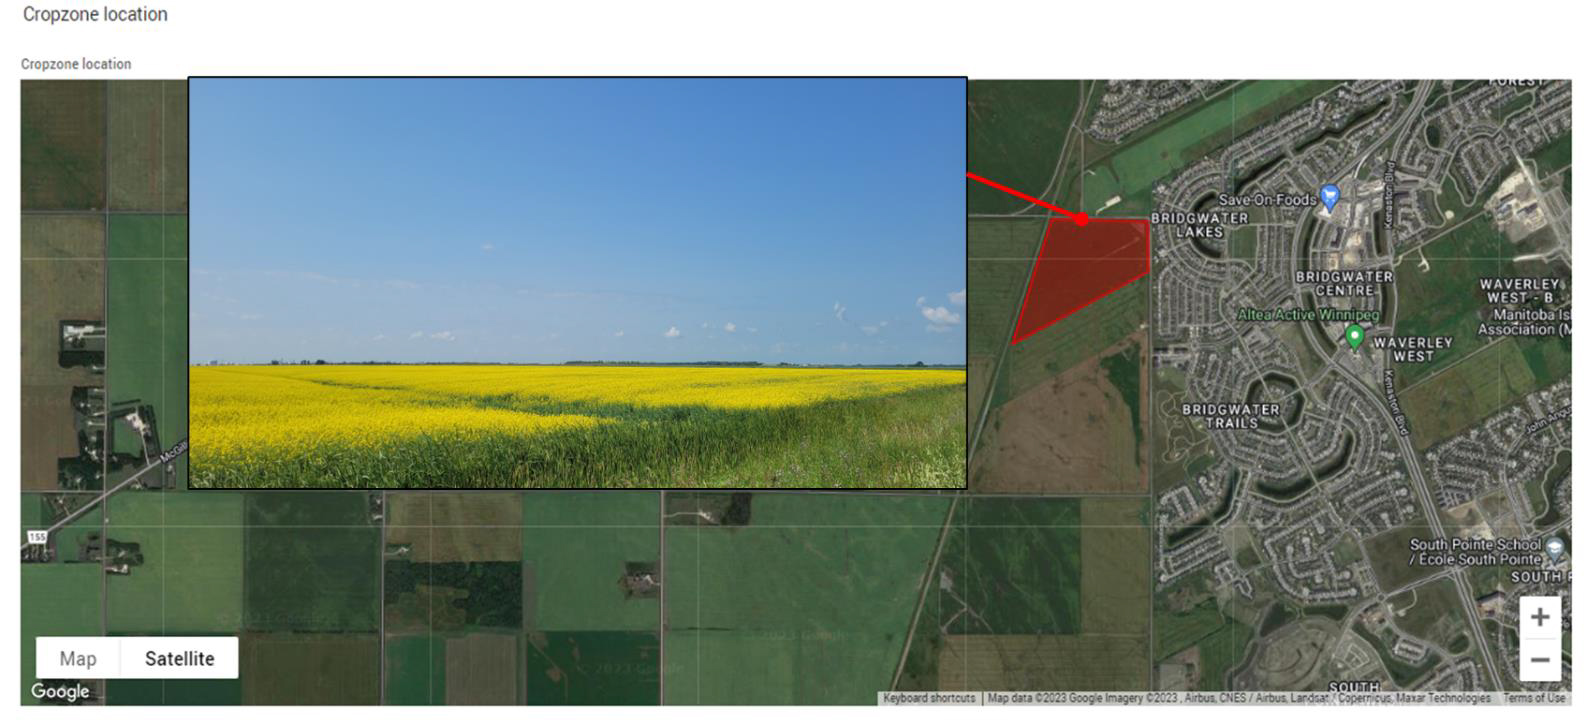
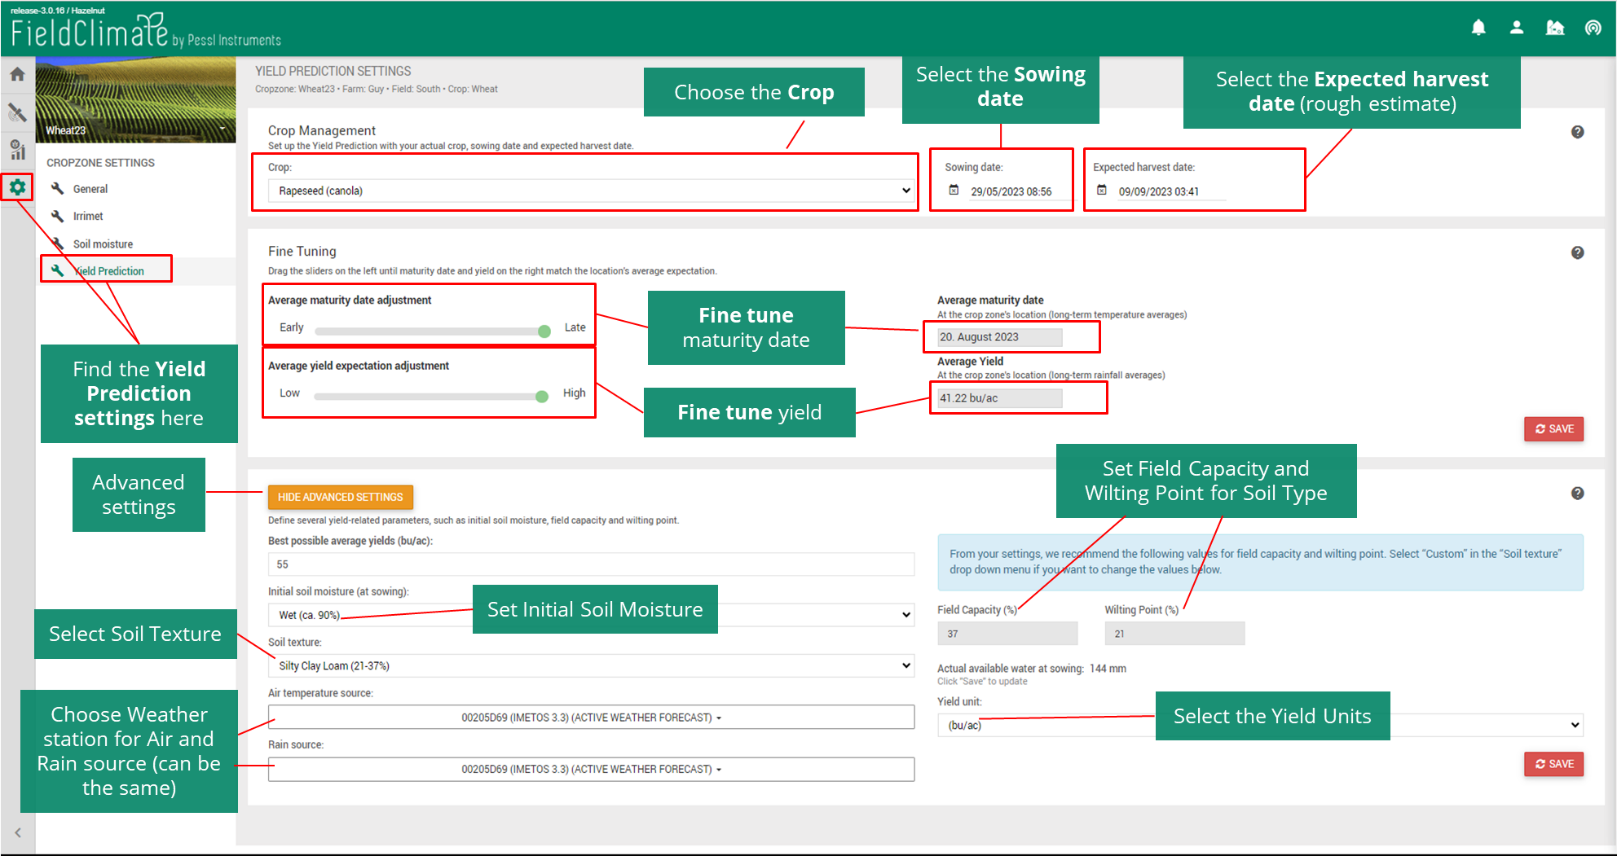
Once a field or crop zone boundary is delineated (red area on the map above), the Yield Prediction Settings need to be defined (image below). The following yield settings need to be defined:
Crop Management
- Crop Type: barley, corn, canola, wheat, wheat (durum) and soybean
- Sowing Date
- Harvest Date
Fine Tune
- Average Maturity Date
- Average Yield Expectations
Advanced Settings
- Initial Soil Moisture
- Soil Texture/Type
- Weather station(s) **In-Field**
- Field Capacity & Wilting Point
- Yield Units
These settings allow for a variety of assumptions and changing them will impact the prediction. The most important is the initial soil moisture, soil texture/type, the sowing & maturity dates, average yields and most importantly, having a weather station at or near the field or crop zone location. You can also fine tune the initial variable type by adjusting the maturity date and yield expectations.
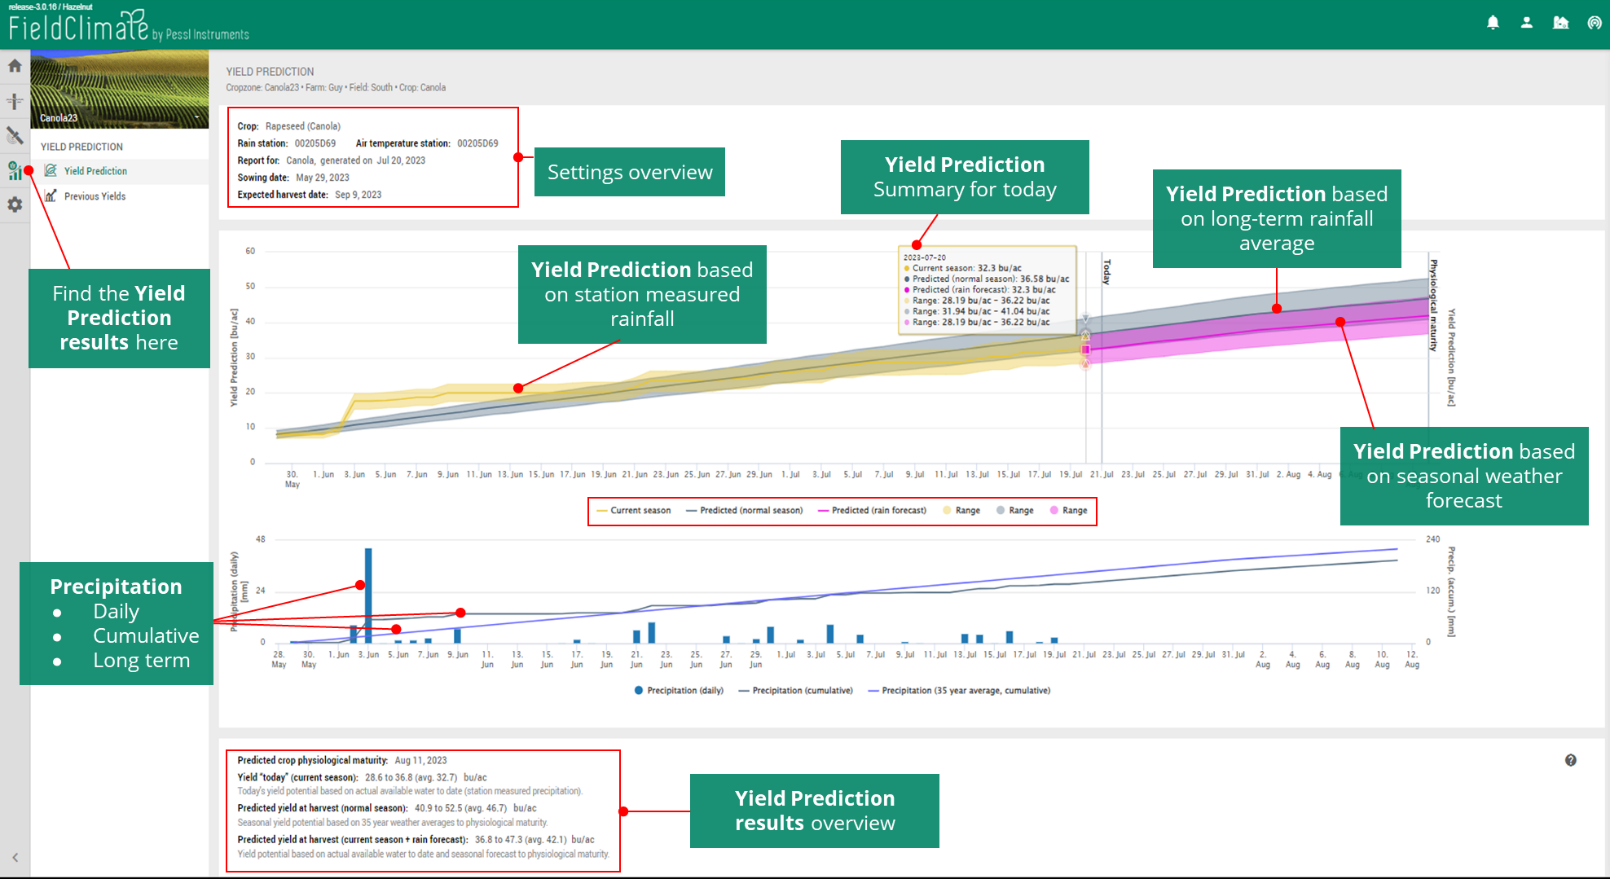
Once the settings have been established in the field or crop zone, the Yield Prediction Results can be examined by clicking the graph on the navigation bar menu. You are then presented with 4 areas: the Settings Overview, the Yield Prediction graphs, the Precipitation graphs and Yield Prediction results overview (image below).
- Settings Overview provides details on the crop type, the station(s) used, when the report was generated, sowing and expected maturity date.
- Yield Prediction Graphs provide details on current yield prediction for the average and range of values based on the stations measured rainfall and the long-term normal rainfall for the current date. The yield prediction to physiological maturity is predicted based on the long-term normal rainfall and seasonal adjusted rainfall forecast.
- Precipitation Graphs provide details on the daily amounts of rainfall, the accumulated rainfall totals, and the long-term normal rainfall for the field.
- Yield Prediction Results Overview provides details on yields today (current season, average and range in values), predicted yields are harvested (normal season, average and range in values) and predicted yield at harvest (current season + rain forecast, average and range in values).
For the field or crop zone highlighted in the first image, today’s current season yield estimate is 32 bu/acre, which is slightly below the long-term normal of 37 bu/acre. At physiological maturity (August 11), the current season average yield estimate is 42 bu/acre, while the range is 37-47 bu/acre. The long-term normal average yield estimate is 47 bu/acre, with a range of 41-53 bu/acre.
Precipitation graphs clearly show that early season above normal rainfall amounts boosted yield potential, but since early June rainfall amounts have been minimal and have been below normal since early July. As mentioned above, it’s extremely important to have a weather station by the field or crop zone for rainfall measurement since precipitation amounts can be highly variable over a short distance. As an example, this field is located about 14 km from the government weather station at the airport, and in one severe rain event, over 1 1⁄2 hours, the difference between the two locations was about 80 mm. To put that amount in perspective, it roughly represents the normal amount of precipitation received in the month of July. For this year, the monthly amounts for May, June, and part of July from the government weather station are 38%, 83% and 34% of normal.
We have discussed in previous Farm Weather Talks (#004) the importance of soil moisture, it’s the crops gas tank, and can help carry a crop through a period of below normal precipitation amounts. This is the case this year, where spring conditions were cool and wet, with good soil moisture levels, and this was reflected when setting up the Yield Prediction: Initial Soil Moisture Conditions as Wet.
There is no need to top up nutrients at this point since the water supply or soil moisture is near normal.
If it rains a couple more times, we should have an average yield for this year.
In combination with the Yield Prediction, Satellite Imagery is available for the specific field or crop zone. Two satellite indices from the Sentinel 2 satellite (10-meter resolution) are shown: LAI (leaf area index) and NDVI (normalized difference vegetation index). Each can be used to either look at the amount of ground cover or the ground cover and vegetation vigor. The higher number, or brighter green in the legend means a more vigorous crop (see image below).
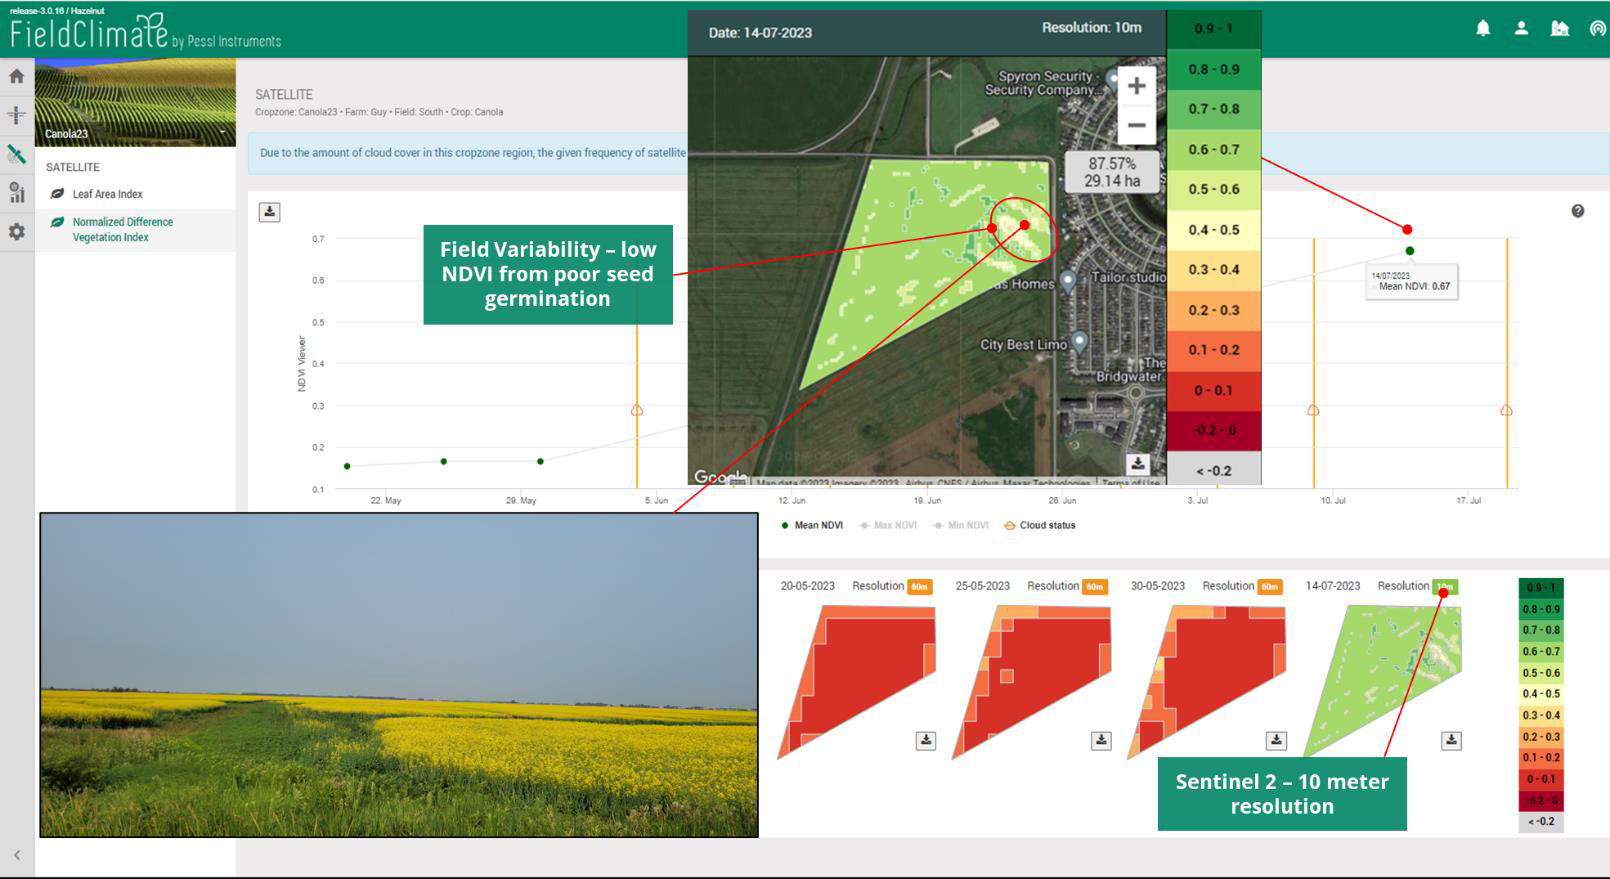
Here we will focus on the Normalized Difference Vegetation Index (NDVI)
NDVI represents plant photosynthetic-activity radiation. It measures the difference between visible and near-infrared (NIR) light reflectance from vegetation. The NDVI values range from 0 to 1. which correspond to vegetation areas.
- Red tones = lower NDVI, least vigorous crop canopy.
- Yellow tones = medium NDVI, medium vigorous crop canopy.
- Green tones = higher NDVI, most vigorous crop canopy. The higher the NDVI value, the greater plant density and health.
This year there is a fair amount of cloud cover, so there are few images available. The image below illustrates the green up of the crop over the growing season, with differences in plant health across the field highlighted.
Higher green areas represent healthier crops, while beige values represent less plant vigor. The imagery clearer shows the in-field variability, which in this case was from poor seed germination to drown out at seeding (see field picture below). Other causes for in-field variability are water, fertility, disease, or insect issues. The peak NDVI value or peak of the curve each year has been associated with overall yield potential and peak biomass development.
Ok, what have we learned so far this year?
Based on predictive crop zone yield and satellite information, a farmer can adjust important management decisions during the growing season regarding water, disease, insect management and additional fertilizer application. Improve nutrient management: right rate and time for higher yields and quality of crops. For the field used in this talk, the Yield Prediction Solution as of July 21, 2023, estimates an average yield of 42 bu/acre, while the long-term average is 47 bu/acre, so no adjustments in nutrients are required (no extra soil moisture).
So, as discussed before, an IoT field device should go hand-in-hand with a field level forecast for the enhanced management decision to help reduce the uncontrollable risk a farmer faces in day-to-day operations.