
Weather – It’s The Variability That’s Hard To Farm With
PART I
Author: Guy Ash, Global Training Manager, Pessl Instruments
For dryland production on the northern great plains, up to 70% of the uncontrolled risk a farmer faces is from weather – yes 70%. Or put another way, 70% of your income is at risk. We all know that weather conditions (e.g. wind speed/direction, precipitation, leaf wetness, soil moisture and temperature) vary over distances or geography, but the impact they have on farm operations is enormous. Do we know, however, that the in-field variability can also be significant? How does this spatial variability impact the day-to-day operations on a farm?
In this settlement of Farm Weather Talk, we will take a closer look at weather spatial variability (conditions to-date and forecasts) and the impact it has on a number of farm management decisions: e.g., seeding, fertility, diseases, irrigation management, yields, work planning and harvest conditions.
INTRODUCTION
Whenever a farmer is in the coffee shop, the talk will at some point turn to weather. “How much rain did you get? 1 inch (25 mm), I got 2 inches (50 mm).”
It’s the spatial variability that impacts the day-to-day operations and can add significant costs or benefits to farm operations. First, let’s look at the various weather parameters and how they vary over geography. It’s well known that weather parameters can be impacted by human land use, such as pollution and the building of cities, soil type/texture, proximity of water to a crop, vegetation cover, latitude, and topography, but what is the impact of these variations on crop management?
In general terms, each weather parameter (temperature, relative humidity, precipitation, solar energy, wind speed/direction, soil moisture and temperature, leaf wetness) is impacted differently by changes in geography, installation heights and locations. The important message we can offer from this edition of Farm Weather Talk, is that if you want to understand the impact of weather on field management, then you need to have weather information and a forecast from the field.
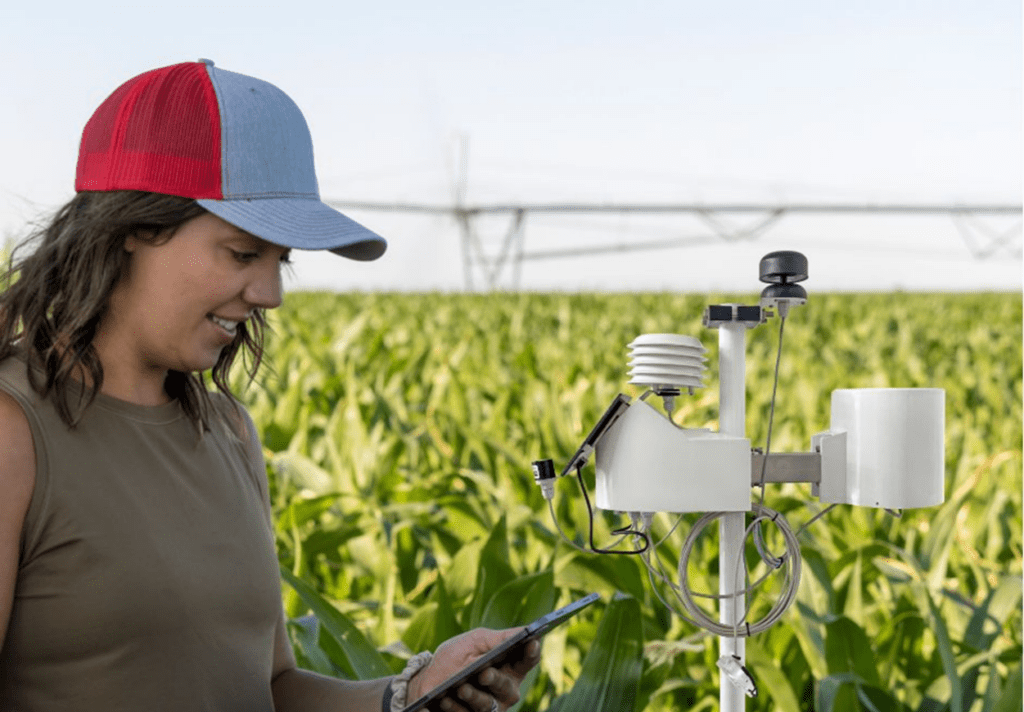
This is the reason why meteorology has been inaccurate and not trusted by farmers for management decisions. The spatial variability of weather and its impact on seeding, fertility, spraying, disease development, harvest and yields requires field level IoT devices for the information to be relevant/accurate and in this talk you will clearly see why this is required.
PRECIPITATION: IMPACTS PLANT DEVELOPMENT, NUTRIENT UPTAKE, PRODUCT DEPOSITION, YIELD, QUALITY, AND FIELD OPERATIONS
Precipitation is highly variable based on elevation and type of weather event (localize storms to more widespread synoptic storms). As water vapor is forced to rise, it condenses and eventually forms clouds and then precipitation. Areas that are upslope from moving storms tend to have higher precipitation events.
This can happen in coastal areas or even areas that have upsloping movement or retrogressing storms forced to move backward upslope. In many areas of the great plains, precipitation during the growing season falls from localized storms or thunderstorms.
The localized nature of these storms results in very localized and potentially heavy amounts of precipitation. It is not uncommon to find a reading of 6 mm (¼ inch) in one field, while a field 1 1⁄2 km (1 mile) away may have 30 mm (1 1⁄4 inches).
YIELD STUDY
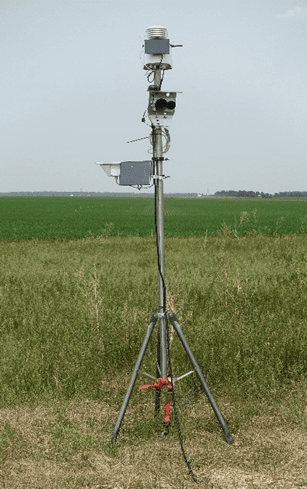
As an example, four IoT devices measuring precipitation were compared in a yield study and were all within 6 to 10 km (3.6 to 6.2 miles) apart.
The IoT device located right at the corn field had a total of about 162 mm (6.4 inches) of precipitation from May 2 to September 2, which is well below the long term normal of 312mm (12.3 inches). The IoT device just to the west of the field (about 6 km, 3.6 miles) had 169 mm (6.6 inches) for the same period, while the IoT device further west (about 10 km, 6 miles) had 234 mm (9.1 inches) and one southwest of the field (about 8km, 5 miles) had 200mm (7.9 inches).
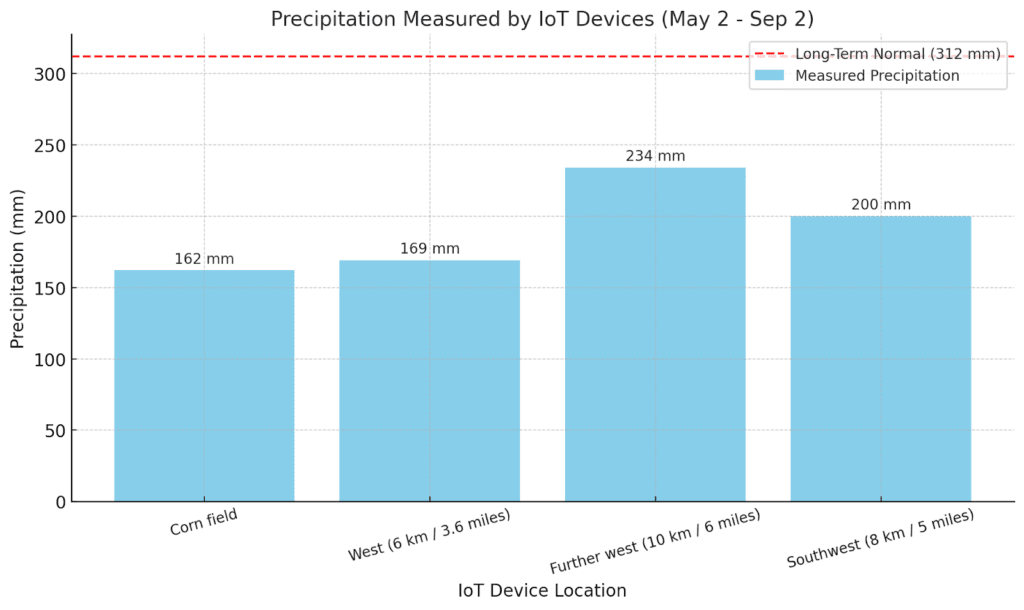
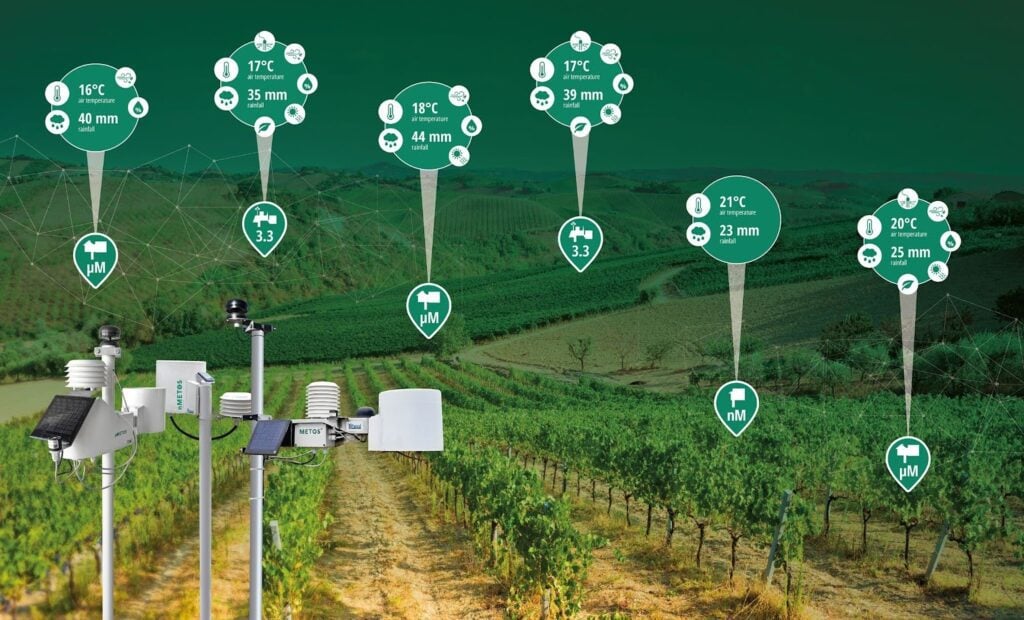
This clearly illustrates the large spatial variability in precipitation (72 mm or about 3 inches between the IoT devices used in this study) on the Canadian Prairies, and the need for in-field IoT devices for yield prediction or any crop analysis. To put this another way, the difference in rainfall totals equates to about a 15 to 35 bu/acre difference in corn yield. At $5 corn this translates into $75 – $175 per acre different in gross income based on the variability in precipitation.
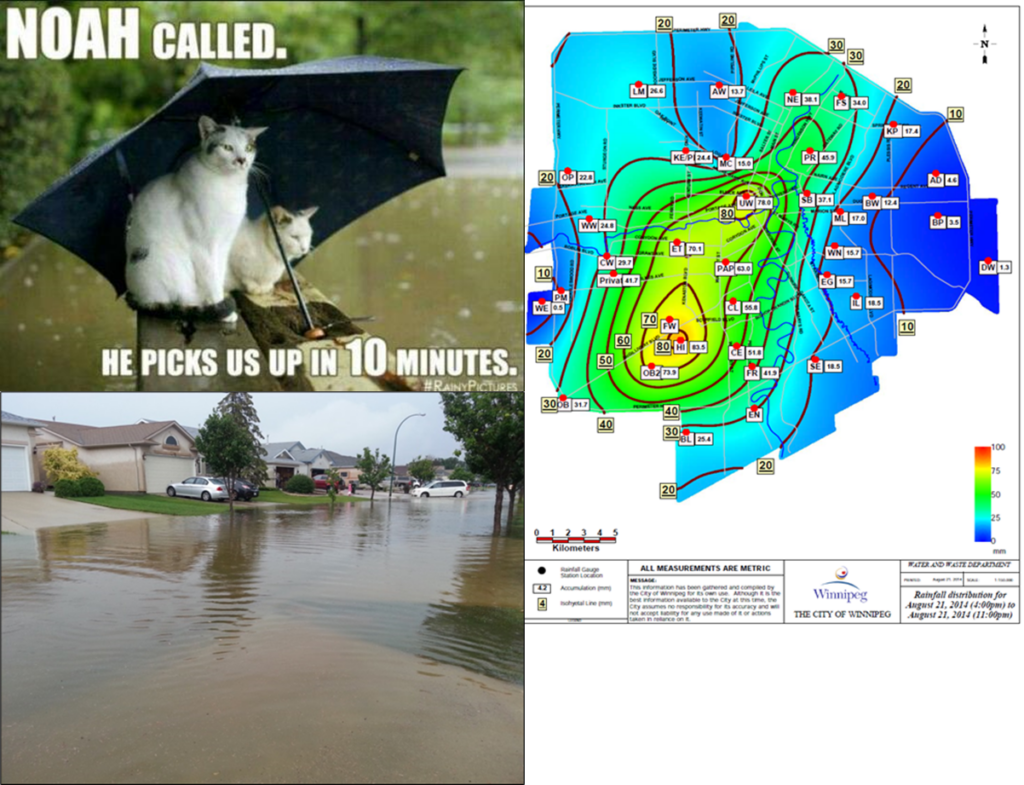
I have personally experienced a storm that dropped 90 mm (about 3 ½ inches) of precipitation in 1 hour and 10 minutes at my location, while the airport weather station (12 km or 7 miles away) recorded 13 mm (½ inch) of precipitation (images below). The impact of this variability results in completely different management techniques, with one area flooding and the other experiencing a nice recharge rainfall event. With climate variability becoming more extreme, the magnitude of these events is growing larger, making farm management risk more difficult to handle and highlighting the essential role of in-field IoT devices.
HOW DOES PRECIPITATION VARIATION IMPACT CROP MANAGEMENT?
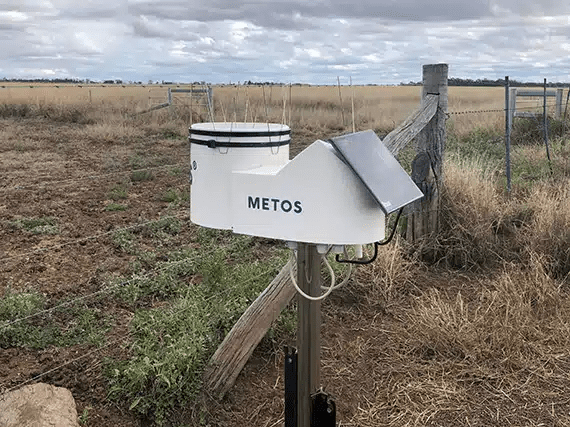
Water is the single most important factor for crop development; it drives all the biological processes in plant growth. Therefore, knowing how much water is stored in the soil from precipitation and/or irrigation is extremely important. Capturing how much precipitation fell or is stored in the soil can be easily done with a rain bucket and a soil moisture probe. To put it another way, each 25 mm (1 inch) of stored water equates to a specific number of bushels for each crop. This topic will be discussed in the last edition of this article in the chapter: Putting it All Together.
Precipitation can also impact seeding, spraying and harvest operations, by reducing field access, product efficacy, and harvest quality (grade losses). Field operations can be managed by a field specific forecast and work planning solutions, which are built for the actual field.
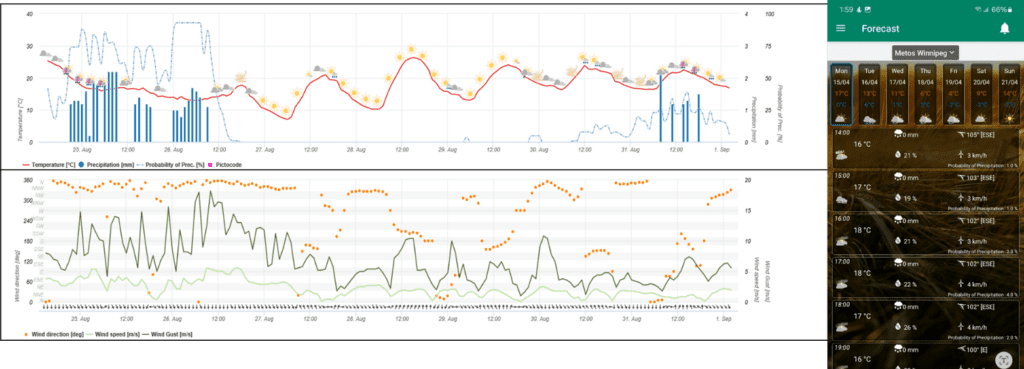
In this case, a field-specific weather station is used to help build a site-specific forecast, with work planning solutions by nudging and tuning the forecast for the actual field location (not the nearest town or based on a grid point), weighting the forecast model performance, using AI to learn the location’s climate, and updating the forecast every hour.
Once a field-specific forecast is created, the RMSE (root mean square error) of the forecast is much lower than that of traditional forecasts, resulting in accurate field-level work planning solutions. These updates occur hourly and provide an hour-by-hour forecast for the next 7 days, covering activities such as tillage, field accessibility, sowing ability, plant nutrition, spraying, and harvest windows, which are highly impacted by precipitation events. More on spraying applications is covered in the temperature section.
KEY TAKEAWAYS FROM PART I
In this first part of Farm Weather Talk – Weather-It’s the variability that’s hard to farm with, we explored how weather variability—especially precipitation—plays a crucial role in farm operations. The differences in rainfall across short distances can significantly impact crop yields, nutrient uptake, disease pressure, and overall farm management decisions.
But there’s more! In PART II next week, we’ll take a closer look at temperature and how it impacts evapotranspiration, cost of spraying inefficiencies, frost damage and protection, dew point temperature, and the importance of site-specific temperature. Stay tuned!
Enjoyed this?
You might also like the PART II that’s coming out next week. Subscribe to be the first to read it.