FarmView video tutorials & manual
FarmView video tutorials
FarmView manual
Table of Contents
1. PREFACE
Farmview: A part of Fieldclimate
Since 2005, FieldClimate platform is an indispensable partner for the agriculture decision-making process and has been improving over the years.
2. HOW TO USE FARMVIEW
2.1 Registration
Identical to the registration at Fieldclimate: FieldClimate registration.
2.2 Login
Identical to the login at Fieldclimate: FieldClimate login.
2.3 Main dashboard
Identical to the dashboard at Fieldclimate: FieldClimate dashboard.
Additional widgets will be available for Farmview in March 2020. These will substantially ease your work with Cropzones by presenting an overview of the selected parameters per cropzone. Stay tuned.
2.4 What is cropzone
Farmview works with so-called Cropzones. Cropzone is a basic unit and represents your field or a portion of your field that is managed identically within given borders during a given time. The common situation would be that a user collects multiple Cropzones per Field and multiple Fields per Farm.
2.5 Farmview main screens
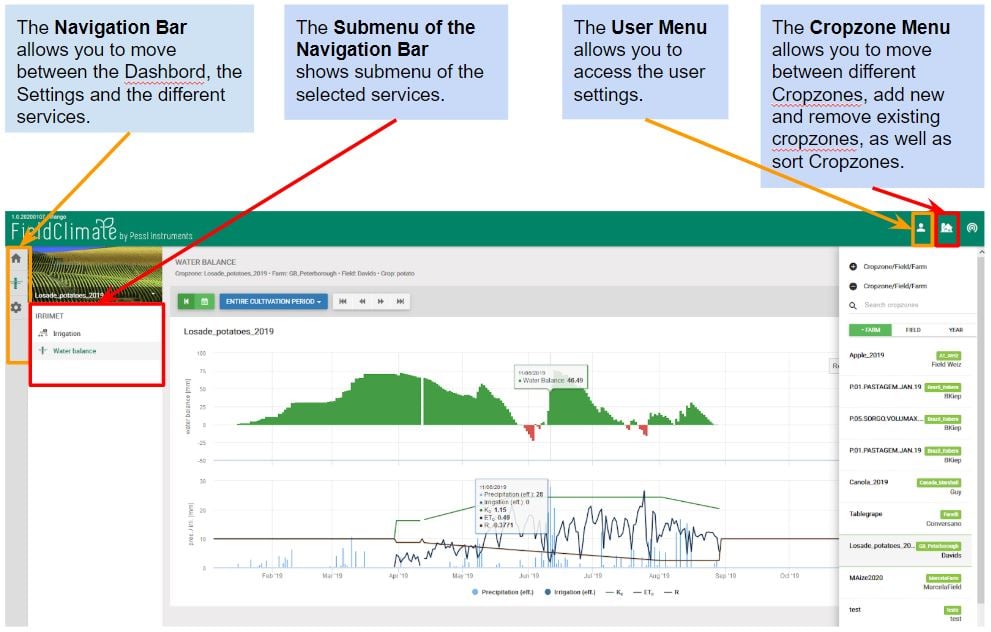
The Farmview main screen consists of three menus. The Navigation Bar on the left allows you to move between the dashboard, the settings and the Farmview services. Irrimet has this icon:
![]()
The Submenu of the Navigation Bar shows the submenu for each selected icon in the main menu. For instance, it shows the Daily water balance and Irrigation calendar for Irrimet. The Cropzone Menu offers an option to move between different Cropzones, adding and removing them by the ‘+’ and ‘-’ buttons at the top of the menu. It also allows you to sort Cropzones based on the Farm name, the Field name and the year. Finally, User Menu allows you to access the user settings such as the language, the units and the passwords.
3. HOW TO START – 123 STEPS
3.1 Add/remove cropzone
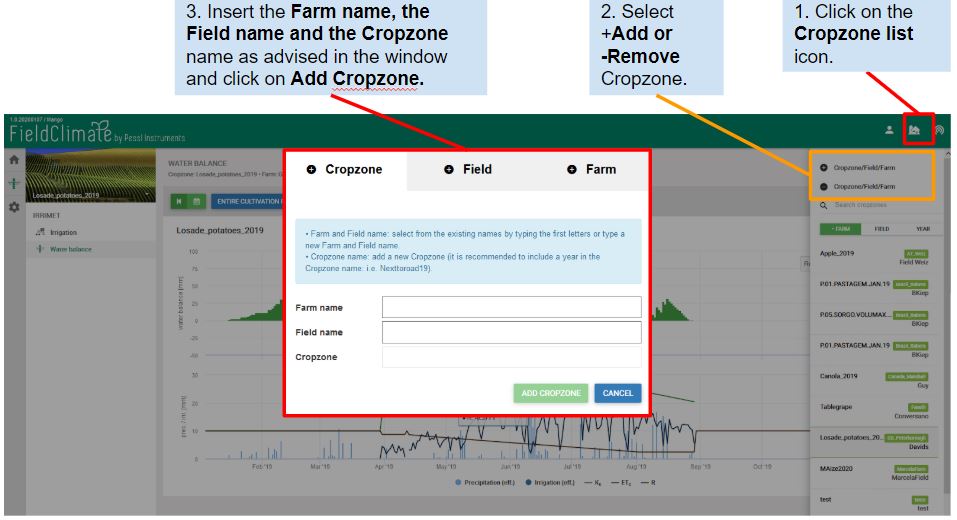
To start using the Farmview services, you need to define your fields. This is easily done by clicking on the Cropzone list > Add cropzone and filling in the Farm name, the Field name and the Cropzone name (photo below).
Farm name refers to your entire farm, while Field name describes a single field with boundaries. While the Farm and Field names stay often identical during multiple seasons or years, the Cropzone name changes as you cultivate new crops.
For a Cropzone, use a name that you can easily identify later. You can even include the year and/or the crop name directly in the Cropzone name, i.e. Nexttoroad2019 or P1_Sorghum_18. This may ease your orientation between different Cropzones in the Cropzone list.
3.2 Define cropzone
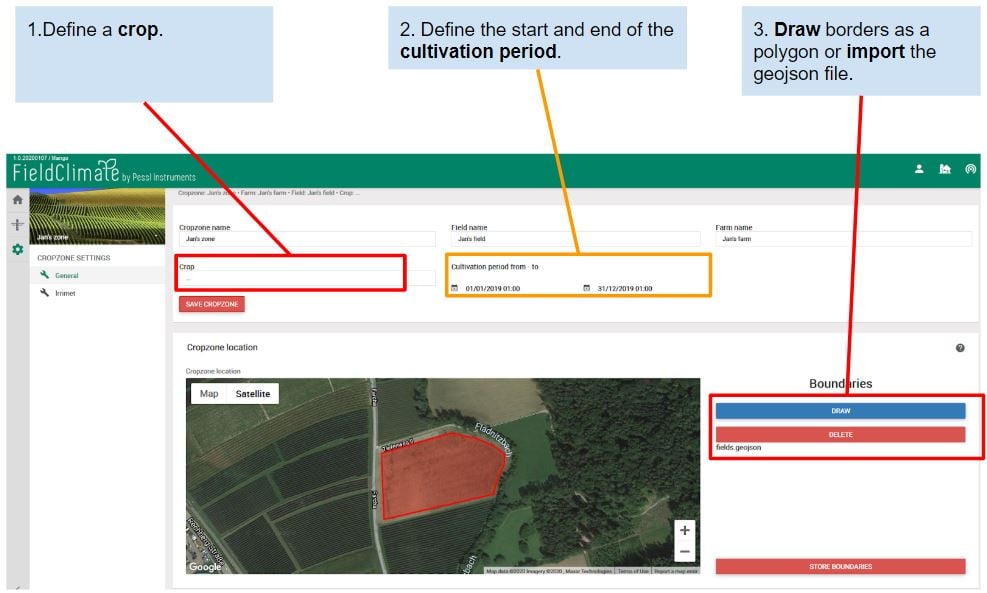
Once you added the Cropzone, you need to define its cultivation period, the grown crop and the boundaries (photo below).
We provide you with model outputs and maps exactly for this Cultivation period. Therefore, define the period so that it includes all your operations of interest. For annual and seasonal crops, define your season or year. For perennial crops, make sure you define every single season in a separate Cropzone as modifications from year to year are expected in the crop development.
Define your Crop (i.e. Apple). The crop name is used for the user’s overview and has no automatic implications in the service.
Identify your Borders. Please include only single polygons. Use a polygon drawing option or import a geojson in a standard EPSG 4326 format. Do not include any holes in the polygon. If multipolygon is imported, only the first shape will be imported.
3.3 Cropzone list, search and filter Cropzones
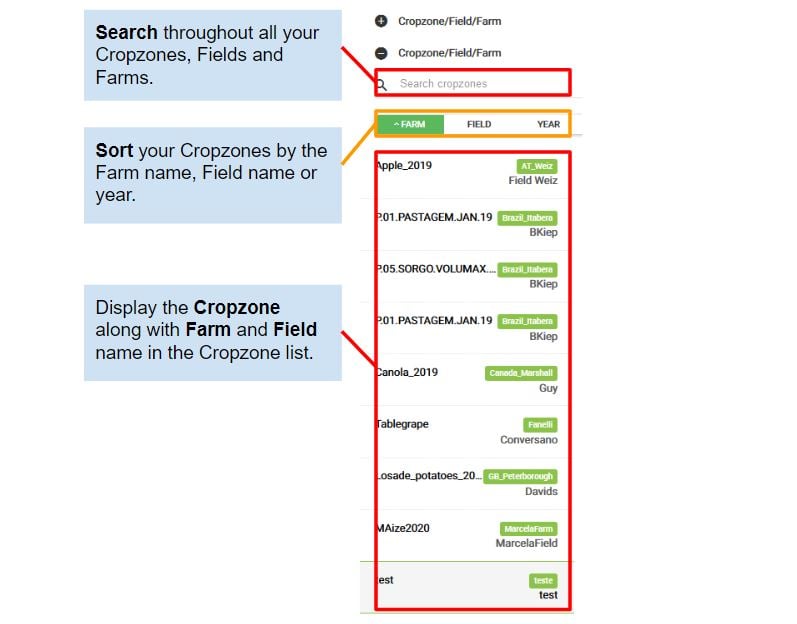
After adding and defining multiple Cropzones you can list them in the overview in the Cropzone Menu (see photo below). Here, you are also offered to remove existing Cropzones and filter and sort them by the Farm and Field name as well as by the year.
You can now start using your Farmview services. The first service is Irrimet.
4. IRRIMET
Irrimet is the first service within Farmview. It monitors water stress within your field and supports you by scheduling irrigation events. Also, it helps you to monitor your irrigation events with the help of an interactive calendar.
4.1 Irrimet requirements
Irrimet module requires sensors for:
- Precipitation
- Air temperature
- Air humidity
- Solar radiation
- Wind speed
4.2 Irrimet settings
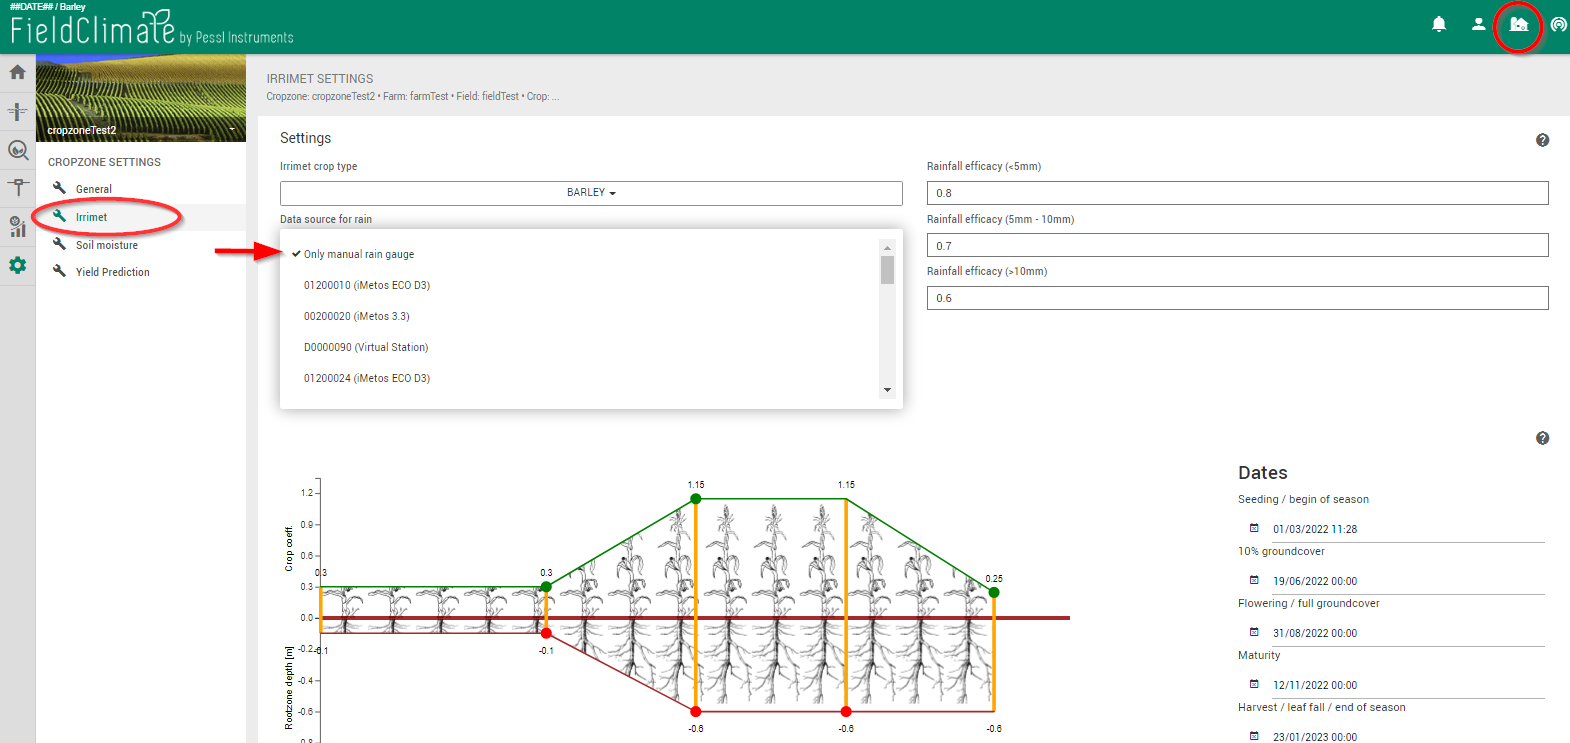
After you have successfully defined your cropzones, you are redirected to the irrimet setting page (photo below). First, you are asked to define your crop from the FAO crop type table. The default FAO crop (evapotranspiration) coefficients and the default root zone depth will be provided in the lower interactive graphic. Adjust them if needed by moving the green/red points up and down.
Next, you are asked to select the ID Number of stations that should provide data for rain and evapotranspiration for this Cropzone. Stations within a 10 km radius of the field are displayed in the selection.
Note: Make sure you select stations that contain data for the season that you are interested in.
Next, indicate rain efficacy: which portion of rain infiltrates the soil. Use default numbers if you don’t have any better information.
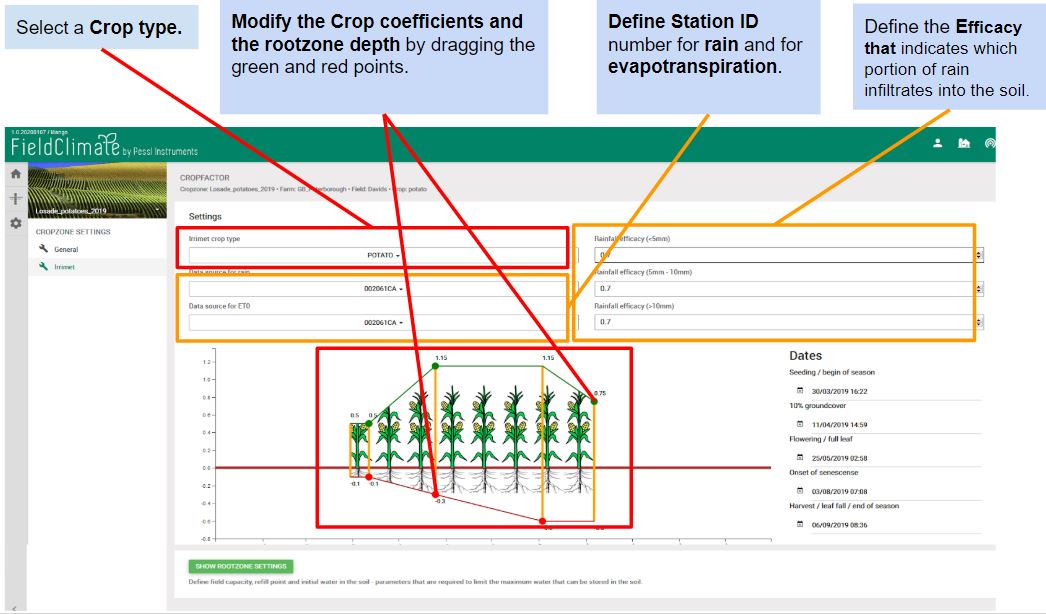
Last, please define the phenological stages for your crop. This is required to correctly model evapotranspiration during the season. The dates can be fastly inputted with the help of an interactive graphic by dragging the orange lines (see the picture below).
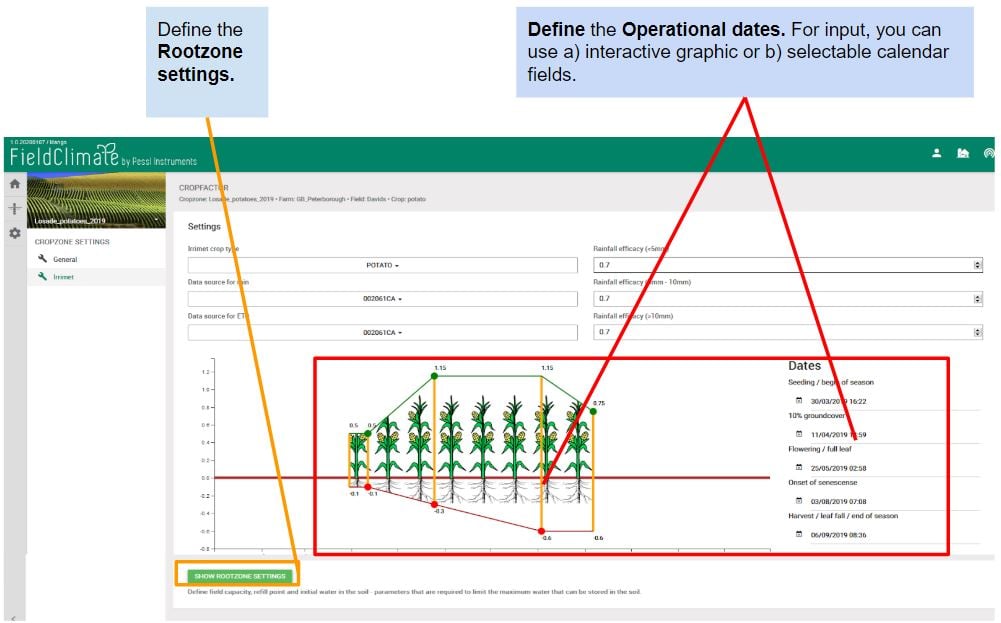
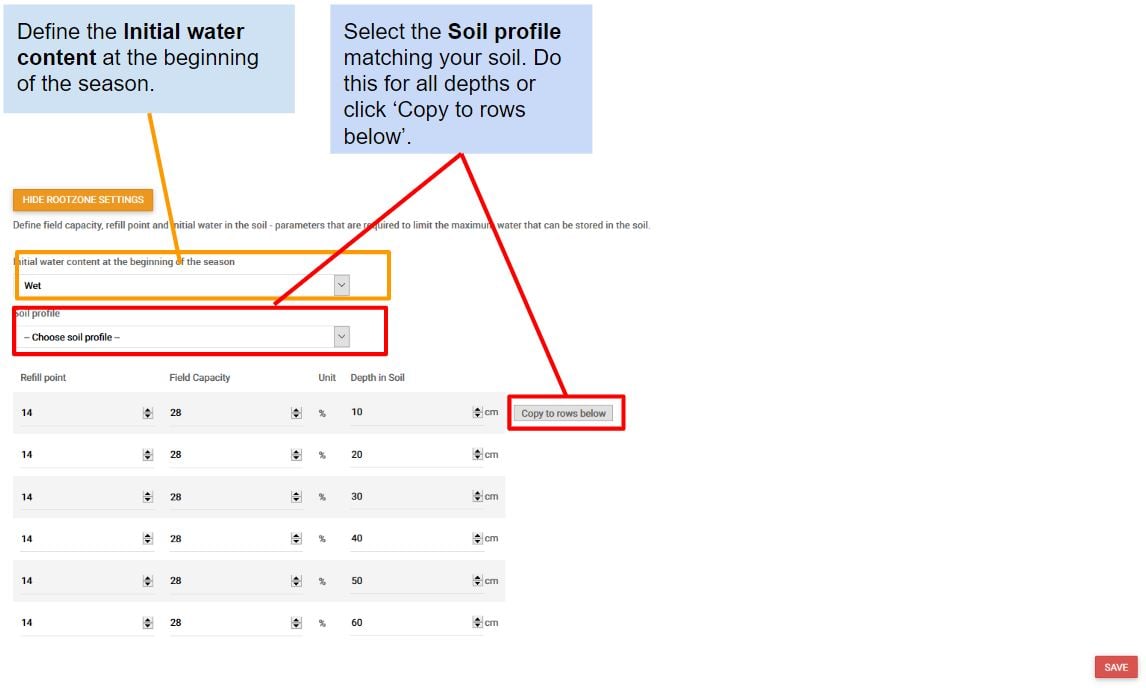
Optionally, you can also define your soil profile information such as the initial water status or the soil type (Root zone settings are located under the interactive graphic, see the photos).
Note: Rootzone settings should be provided especially in areas with water abundance. In such areas, water that can be held by the soil should be limited in the model.
4.3 Daily water balance
Finally, you are ready to study water stress and water surplus in your field (photo below). For the daily water balance computation, we used the daily rain and evapotranspiration data from your station, the crop coefficients and the management dates. The evapotranspiration was computed according to the FAO-56 Penman-Monteith equation. If any irrigation events were reported (see the next chapter), these will be also considered.
The lower graphic shows all the input data. The upper graphic displays the Daily water balance, where green represents water surplus and red water deficit. The maximum water balance is limited by the Field capacity and Refill points that you provided in the Rootzone settings. If a rain event occurs after any water stress period (red colour), the daily water balance is automatically computed from 0.

4.4 Irrigation
Our interactive calendar (see the picture below) enables you to input your single or regular irrigation events. These are then immediately considered in the daily water balance computation (previous chapter).

You can input your events by clicking on the date in the calendar and filling in the Event name, the Irrigation type, the Irrigation Start and the Duration (see the photo below).
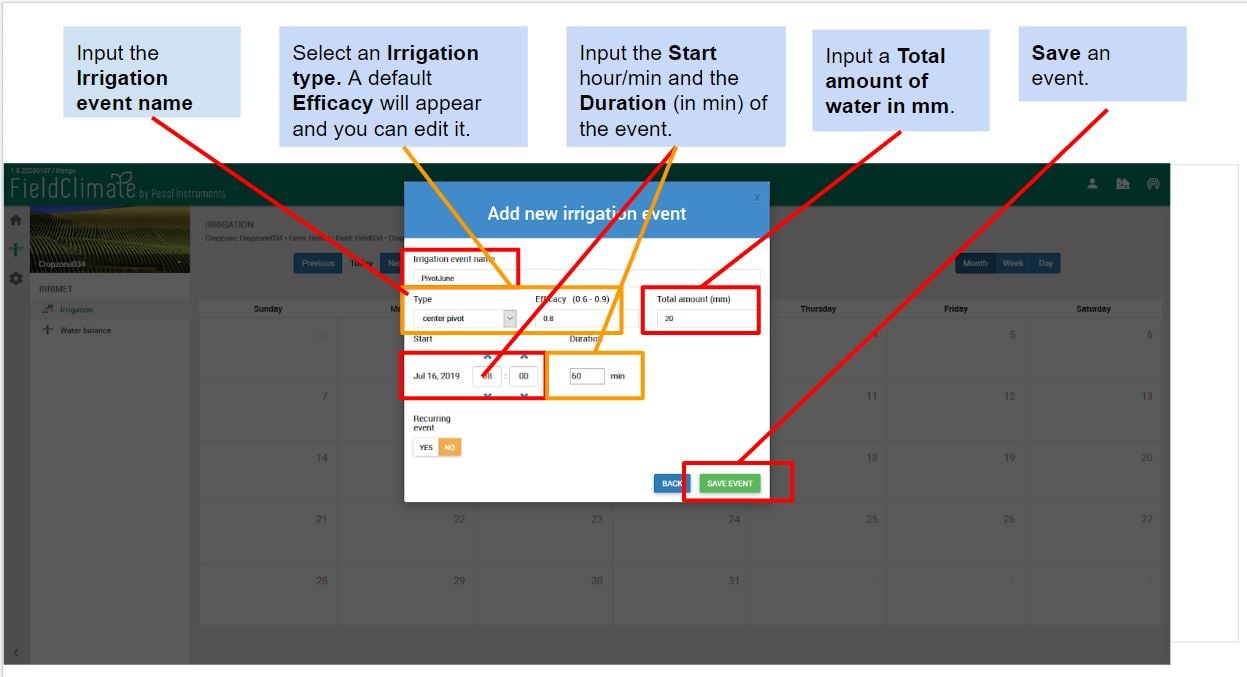
For recurring events, you should (in addition to the previous) activate the Recurring event button, and input the Frequency and the End of schedule prior to saving events.

4.5 Manual entry for precipitation – in FarmVIEW
Manual Rain Gauge allows users to enter manual precipitation data through the FarmView calendar. The rain events that would, normally, come from virtual or physical METOS stations, is now quantified from manual rain entries from the Irrimet Calendar. This is an alternative for associating rain entries to cropzones, instead of stations.
How to set the Manual Rain Gauge?
You will need FarmView to use this tool. When setting up your Irrimet settings -> choose inside Data source of rain the option for “ONLY MANUAL RAIN GAUGE” -> save settings -> enter Irrimet calendar -> start adding precipitation events from there.
How to add rain events to the Irrimet calendar?
The calendar counts with two tabs (Irrigation and Rain events). When clicking on particular day in the calendar, those options will appear.
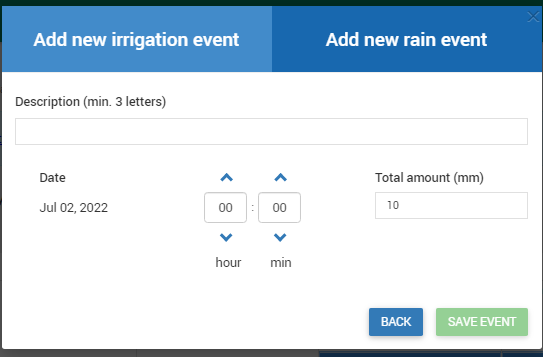
In case an Irrigation or Rain event lasts longer than 24 hours, this event will be split into two (or more) days, and this will be reflected on your calendar (split days are shown in purple), in terms of time and water amount for each day.
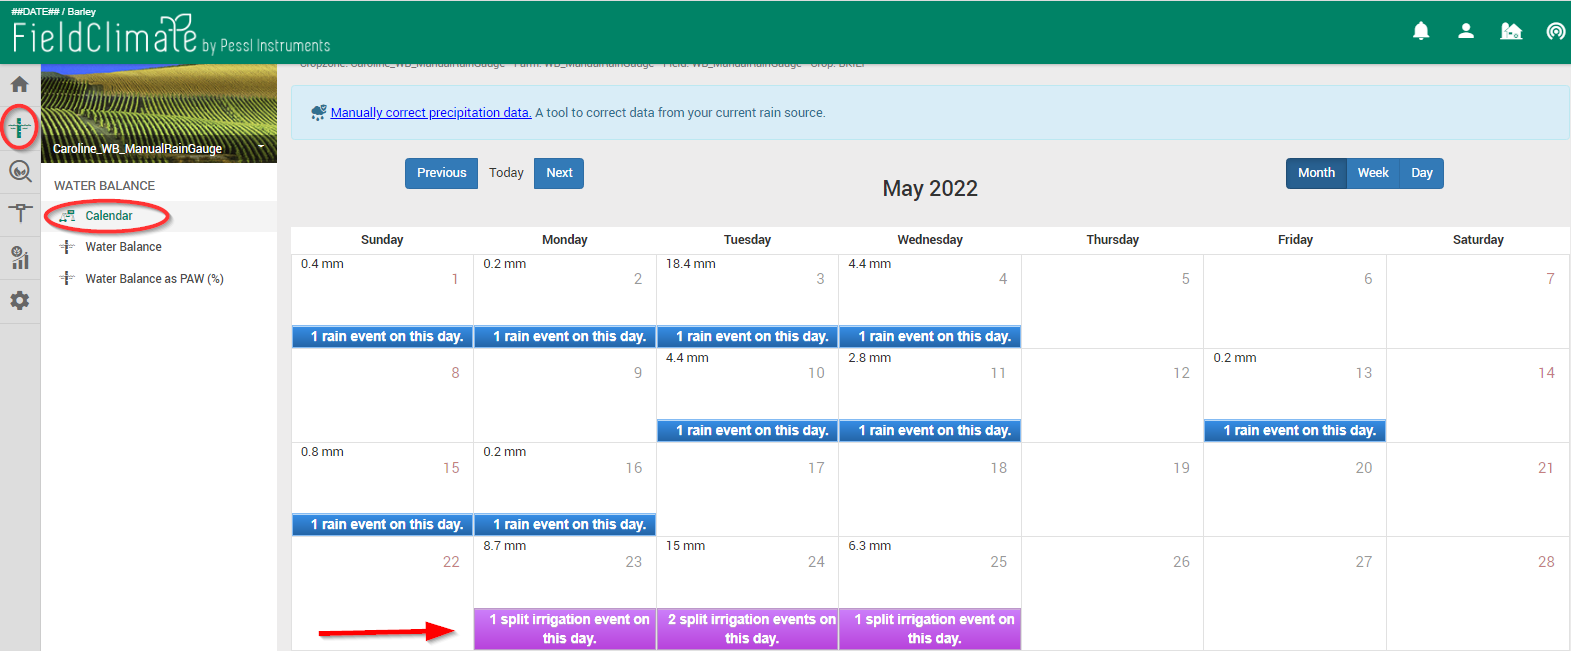
Entries will be quantified in the total Water Balance calculation, likewise, can be seen on the table for the Water Balance and Water Balance as PAW % pages.
5. YIELD PREDICTION
The Yield Prediction tool provides a water-limited grain yield estimate based on rainfall data from METOS physical or virtual station measurements, seasonal weather forecasts, and user settings for soil texture and moisture conditions. It shows a comparison of the current season’s Yield Prediction vs. Yield Prediction based on the 35-year historic averages of rainfall for your specific location. Yield Prediction helps you make an informed decision when it is time to fertilize or irrigate in a water-limited environment.
Yield Prediction includes the important crops wheat, durum, barley, rapeseed (canola), soya beans, maize, potatoes, and sugar beet. The settings allow an easy setup for any suitable location worldwide.
5.1 Yield Prediction requirements
Yield Prediction requires a weather station with:
- Precipitation sensor
- Air temperature sensor
- Active Weather Forecast subscription
You can use your already existing physical stations with the required sensors or also a virtual weather station.
5.2 Yield Prediction settings
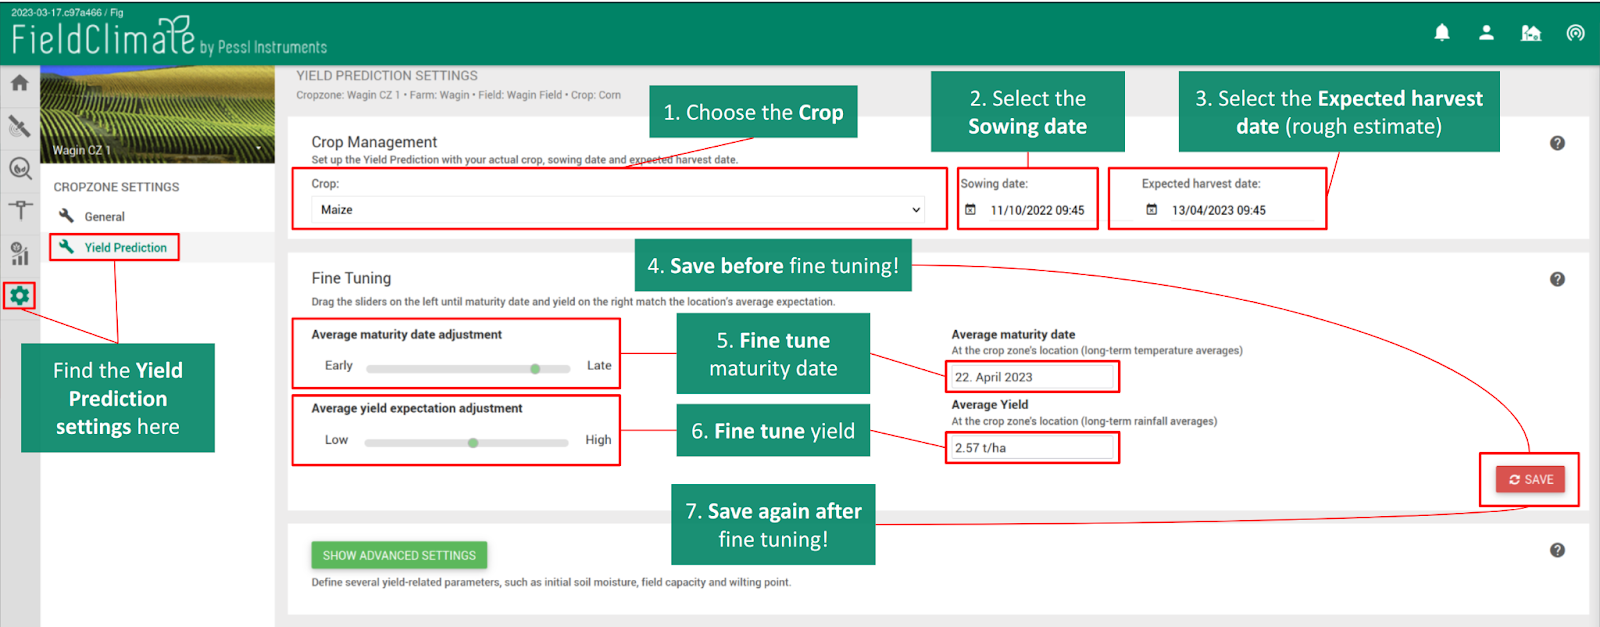
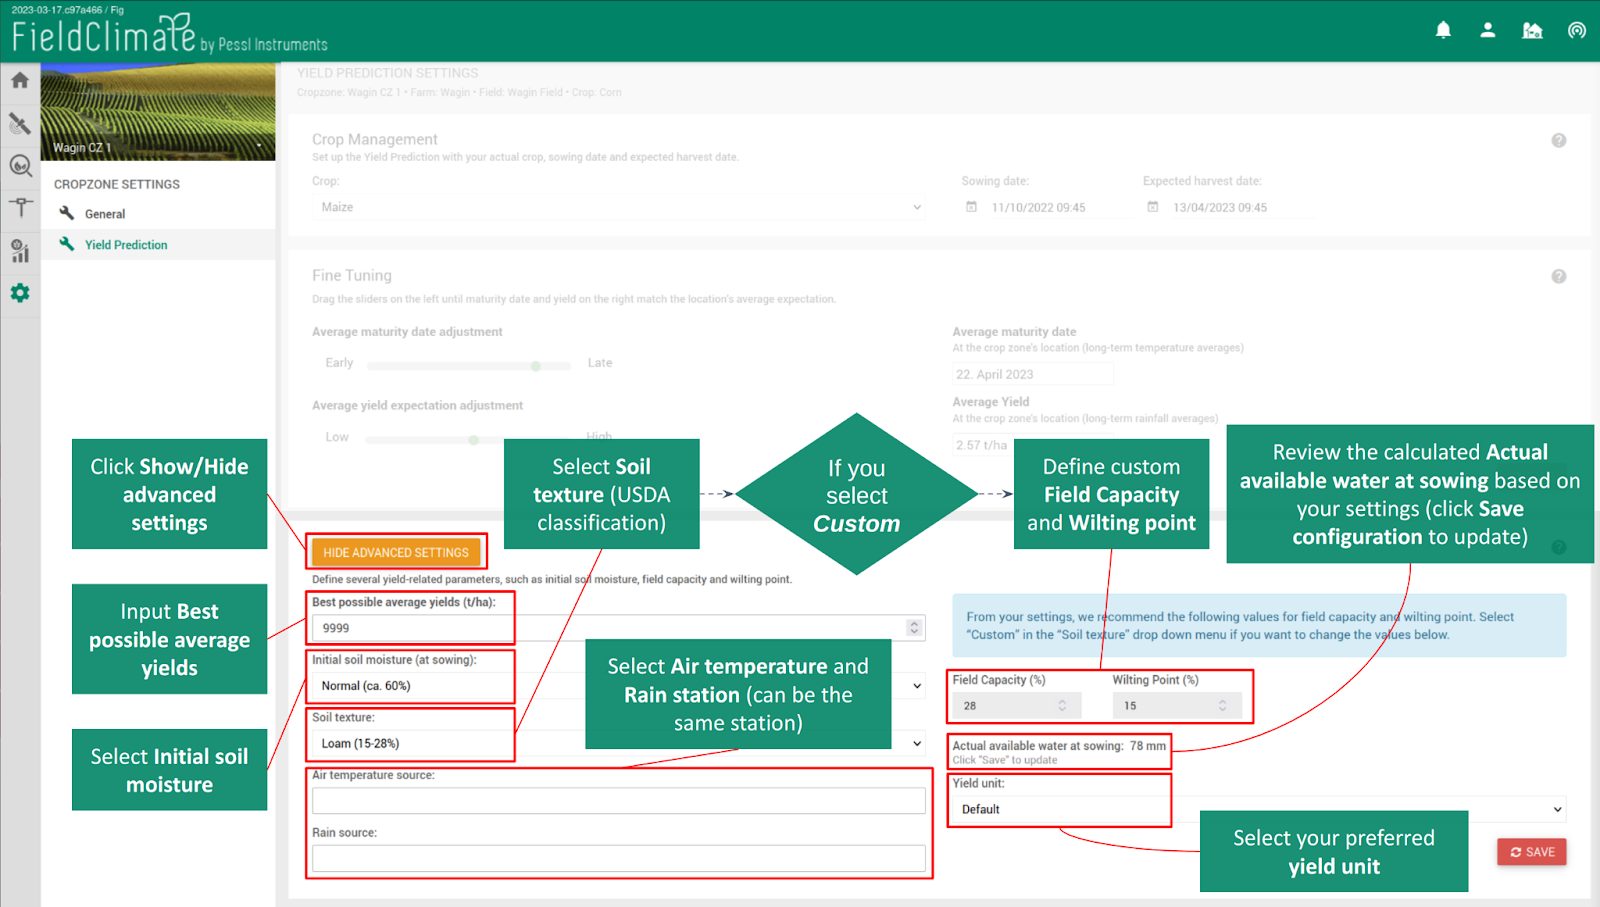
After you have defined a cropzone, navigate to the Yield Prediction setting page (see the pictures below). There are only three simple inputs required: crop, sowing date, and expected harvest date (a rough estimate is sufficient). This is already enough to get the first results, as the more advanced settings are pre-filled with defaults. You can directly go to the Yield Prediction results page by clicking on the Yield Prediction icon on the left (see the picture in 5.3 below), or have a look at the fine tuning and advanced settings (continue reading here).
The fine tuning of the Yield Prediction settings is done by moving the sliders. Average maturity and yield are recalculated automatically. Note that not only the crop, but also the selection of sowing date, soil texture (advanced setting), and the weather stations affect the fine tuning. Follow these steps:
- Select the crop, sowing date, expected harvest date.
a) Optional: go to “advanced settings”, make changes. - Click save.
- Look at “average maturity date”. Does this date seem realistic?
a) If the date is too early: move the “average maturity date adjustment” slider a bit to the right. Wait until the date is recalculated. Repeat as often as necessary.
b) If the date is too late: move the slider to the left. - Look at “average yield”? Is this yield realistic, as an average for this location?
a) Too low? Move the “average yield expectation adjustment” slider a little to the left.
b) Too high? Move the slider to the right. - When finished, click save.
- Go to Yield Prediction and see the results. These are now fine tuned based on the slider settings.
The key advantage of this fine tuning method is that different environmental and crop genetic (cultivar) prerequisites can easily be adopted. Fine tuning can be used to adapt to many situations, for example:
- Growing new crop varieties with higher yield
- Growing new crop varieties with shorter or longer growth duration
- Different climatic conditions
- Generally low soil fertility
- Distinction between winter and spring varieties
When clicking “Show Advanced Settings”, additional setup parameters can be modified. “Best possible average yields” will put an upper limit to the Yield Prediction. The “Initial soil moisture (at sowing)” accounts for the stored soil water at the time of sowing. Percentages indicate the amount of actual available soil water (i.e. between wilting point [0%] and field capacity [100%]). Use your best judgment here: How much water did the previous crop use? How much rainfall occurred prior to sowing?
Soil texture can be selected based on the USDA soil texture classification. This will, in conjunction with initial soil moisture, define the initial “Actual available soil water at sowing” displayed at the lower right end of the section. Remember to click “Save” to update the value.
Soil texture can also be set to “custom”. This allows setting field capacity and wilting point manually. You should only do this if you have a trustworthy source such as a laboratory analysis of your soil.
“Air Temperature Source” and “Rain Source” will list all of your stations within 10 km radius from the cropzone. These can be both physical and virtual weather stations. However, one of the selected stations must have an active Weather Forecast subscription, since Yield Prediction uses a seasonal weather forecast. It does not matter to which station (air temperature or rain) the Weather Forecast is tied. You can also select the same station for air temperature and rain source (this will be the most common case).
You can also change the displayed yield unit. For instance, when the general setting is “metric”, then “t/ha” will be used by default. You can change this here to “bu/ac”.
Note: Make sure you select stations that contain gapless data from the sowing date onwards.
5.3 Yield Prediction results
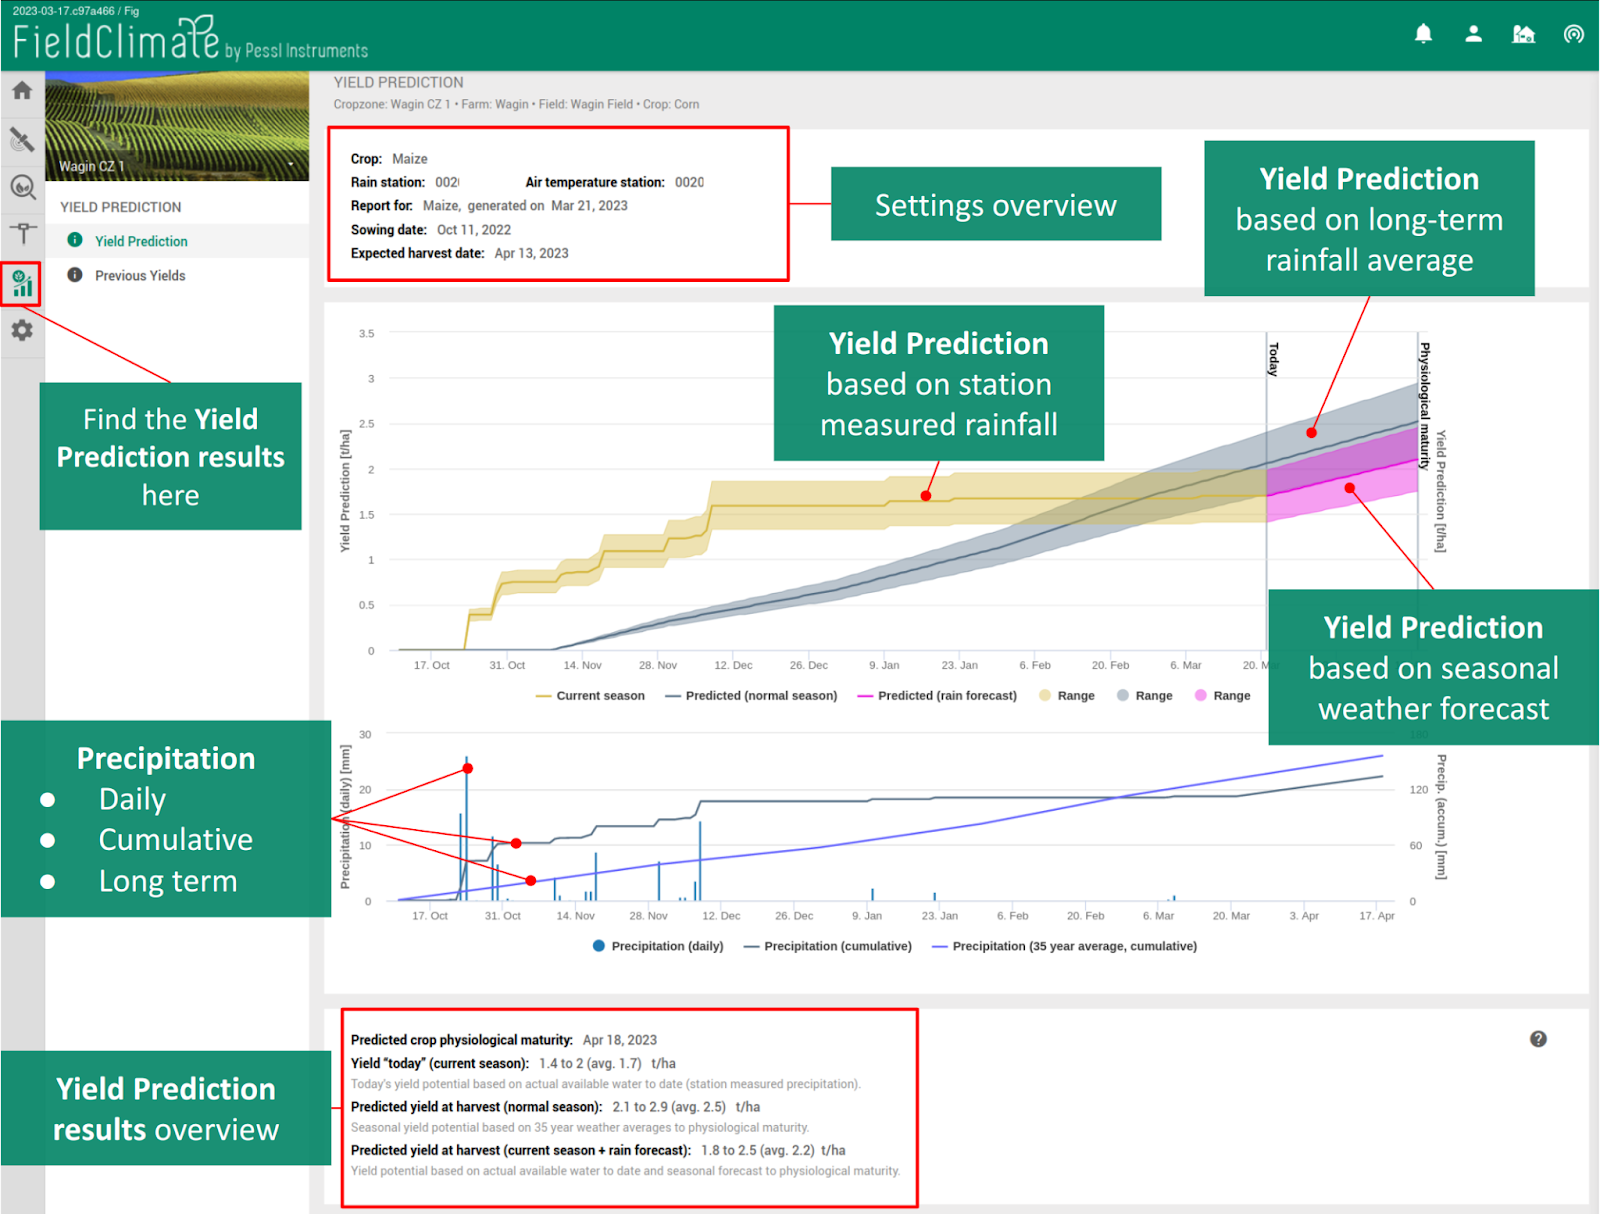
Finally, you are ready to study the Yield Prediction result for your field (Figure 14). On the top of the page (below the gray cropzone overview) you will find an overview of the settings for yield prediction, including the date when the Yield Prediction results were calculated (usually every day). At the bottom of the page, a summary of the important prediction results is shown.
The main chart area shows the Yield Prediction from sowing until the estimated date of crop physiological maturity. Note that harvest ripeness occurs several days to weeks after physiological maturity, depending on the crop and weather conditions, but yield does not further increase in this time period.
The gray area in the chart shows the time series of predicted yield based on long-term rainfall average for the field. The orange area shows the Yield Prediction based on actual station measured rainfall up until today, and the pink area complements this – based on a seasonal rainfall forecast – up until crop maturity. At a glance, the final values of the gray and pink areas indicate whether the current season’s yield is likely to be above, below, or similar to the long-term average. In the example (see the picture), the season was wet at first, but then very dry and Yield Prediction fell far below the long-term average.
Crops are also color-coded for your convenience: Orange for wheat, yellow for canola, brown for barley, dark yellow for maize, green for soya beans, bright orange for durum, and sand-brown for potatoes.
Below the yield prediction graph you will find another graph showing precipitation. It includes measured daily precipitation from the station (bars), cumulative precipitation from station measurements and forecast (grayish line), and cumulative long term average precipitation (blue line). Having this graph directly below the yield prediction helps understand the influence of water on yield.
5.4 Previous Yields
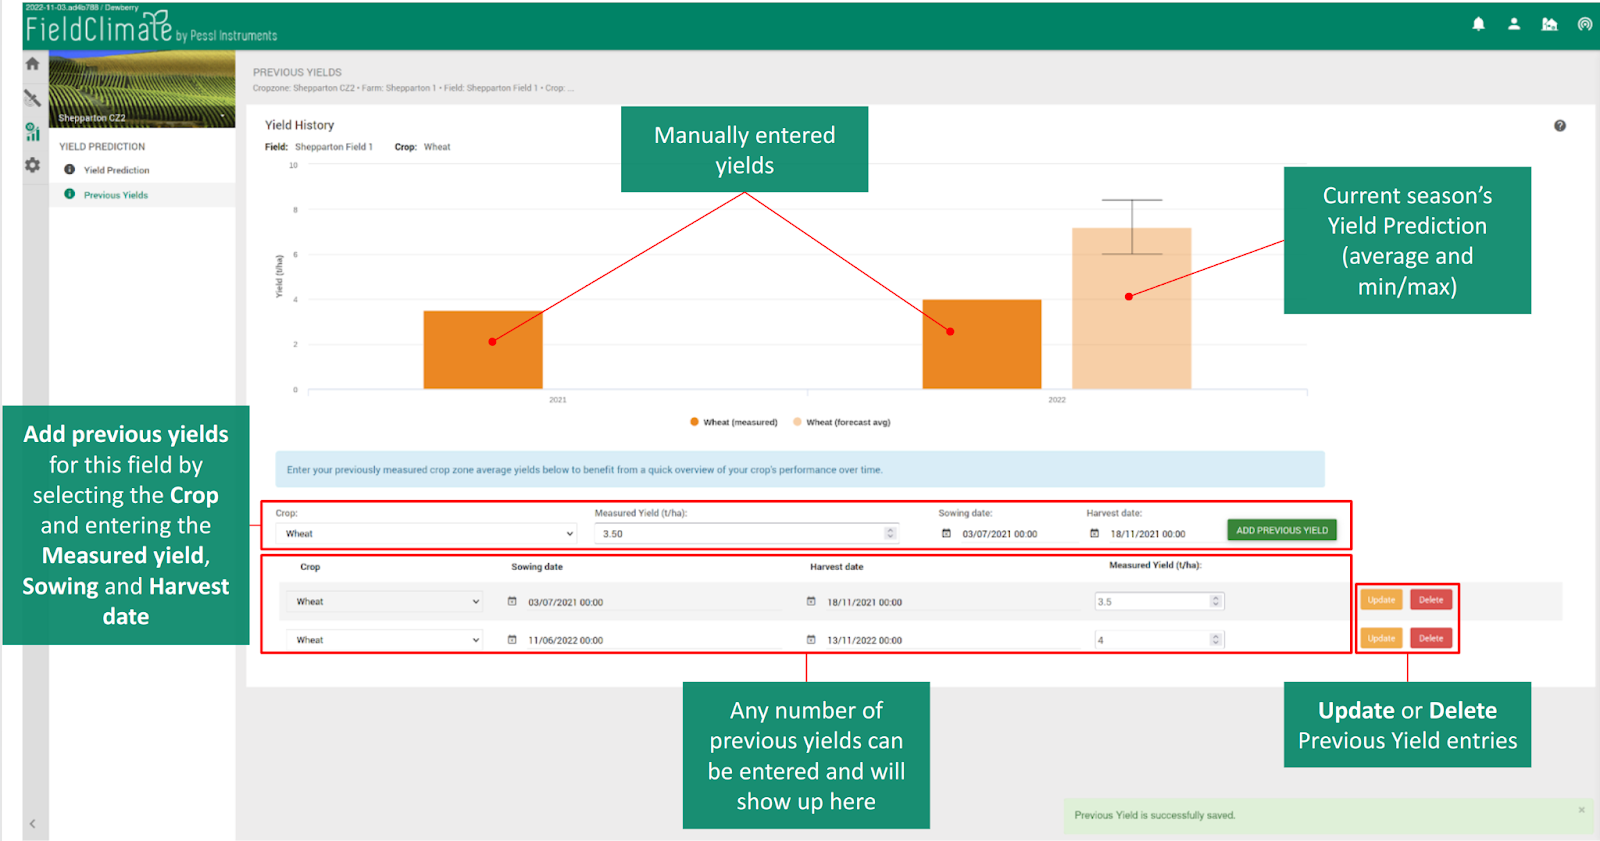
Yield Prediction comes with the Previous Yields page which provides a convenient way to keep track of your crop’s yield performance over time (picture below). Below the chart area, measured yields for the selected field from previous years can be entered manually. These will show up immediately in the chart area, which also includes the current Yield Prediction. This gives a handy overview of the trend of yield performance, possibly indicating necessary actions or confirming the current strategy.
5.5 Yield Prediction limits and future updates
Yield Prediction is exclusively based on water availability and the duration of the growing period: Each unit of water (mm, inch) available to the crop during the growth period translates into a certain amount of yield (tons, bushels per area), depending on the crop/cultivar. A certain minimum amount of water (ca. 100 mm or 4 inch) is necessary for crop development before any yield is produced. The Yield Prediction tool factors all this in and is, therefore, most suitable to be applied in regions where rainfall is the decisive factor for yield buildup such as semi-arid climate zones. Other potentially yield-affecting factors (e.g. weeds, pests, diseases, nutrients) need to be managed well, as these are not considered in the Yield Prediction tool.
Yield Prediction is shown as ranges to indicate that there is a considerable degree of uncertainty in the estimate, e.g. from the seasonal weather forecast. However, even if the weather forecast turns out to be fairly correct and everything is managed well on the field: While Yield Prediction is likely to be precise, there is still no guarantee that actual yield will be within the predicted ranges. The reason for this is that yield is the result of a multitude of factors, and no crop model can cover all of them. Still, when applied in a suitable manner, Yield Prediction can provide valuable information for decision making, for instance when nitrogen fertilization amounts need to be decided.
As mentioned, Yield Prediction can easily be configured for any location. Note that the default values in the fine tuning are parameterized for conditions in northern areas of North America.
Yield Prediction does currently (March 2023) only offer grain yield, assuming average moisture content in grains. Other harvest products (e.g. silage, fresh corn, whole plant, etc.) are currently not available. Also, there is no option to directly add irrigation to Yield Prediction. However, in the station’s settings, you can use the “Correct Precipitation Data” option to manually add irrigation data as if it was precipitation. This will reflect in Yield Prediction.
6. SATELLITE PAGE
6.1 Satellite LAI-dynamics
Take a look at the video for the Satellite Module release. Check all the possibilities to work with satellite data, moreover, to combine it with FarmView and FieldClimate features for full data integration.
Among the several benefits, LAI-Dynamics Module offers:
- Biomass Viewer graph: based on Leaf Area Index (LAI) quantification, at any given time, space (cropzone) and crop type.
- Identify regional differences of growth development in the same CropZone: field variabilities and heterogeneity can be easily identified with satellite images together with biomass data.
- Closely monitor growth stages and crop development
- Correlate growth stages to weather conditions such as GDD graphs from FieldClimate, disease models, weather forecast, Irrimet data.
- High-quality satellite imagery from Sentinel-2 satellite, with 10 m resolution combined with LAI scale of biomass development, updated every 5 days.
6.1.1. PREFACE
LAI-Dynamics Based on Satellite Data is a new Module under FarmView software. FarmView is offering you more details and data zonation, to better support your crop management decisions.
Since 2005, FieldClimate platform is an indispensable partner for the agriculture decision-making process and has been improving over the years.
6.1.2. HOW TO USE FARMVIEW SATELLITE
6.1.2.1 Subscription acquisition
To obtain access to the Satellite Module, customers will need an extra subscription inside FarmView.
6.1.2.2 Login
To access Satellite features, you will need to login to Farmview first. Under your Satellite credentials, the user can find the satellite icon on the left side of the page. Satellite has this icon:
![]()
6.1.2.3 Main dashboard
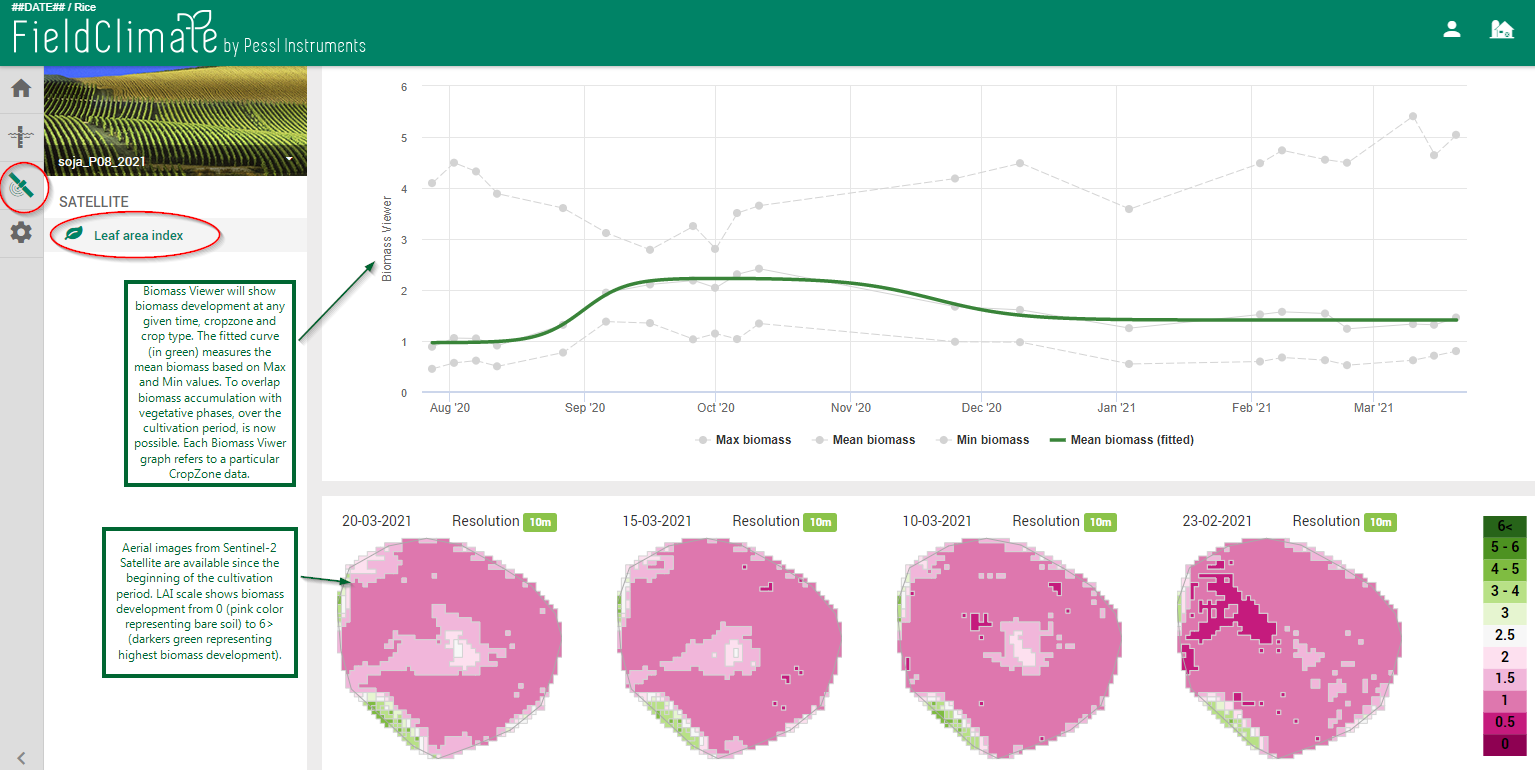
CropZones will automatically be displayed inside the Satellite Module, so there is no need to add them or change any settings. The main Satellite dashboard will show Leaf Area Index tab, with the Biomass Viewer graph, followed by satellite images. Page will look like this:
6.1.2.4 What are Biomass Viewer and LAI
LAI (Leaf Area Index) is the canopy area per unit of horizontal ground area. The biomass LAI can vary on a scale from 0 (bare soil) to 3-4 (highest LAI for tomatoes or wheat), to 5-6 (highest LAI for maize, soybeans). Expected LAI will vary between crops, likewise, be influenced by environmental conditions such as sunlight, climate, water availability, nutrients, etc.
The Biomass Viewer graph will present biomass development over time. Each Satellite page refers to a specific CropZone and will show all the data out of it. To understand daily biomass accumulation over time is crucial to track growth stages and, consequently, yield potential.
To monitor growth stages allows growers to plan ahead crop management from planting day to flowering, and determine the best days for harvesting. Moreover, it can be combined to temperature data via the GDD Accumulator tool, in FieldClimate. Once users have all the data for crop-temperature threshold, GDD, and biomass development, field decisions become more complete.
6.1.2.5 Data options
- Monitor growth stages of multiple cropzones:
biomass accumulation over time allows users to identify crop-growth stages such as Vegetative phases (planting to flowering), maturity, and harvesting timing. Get the best out of your crop at the right time.

The crop of soybeans was monitored with Satellite Module, throughout the cultivation period. Possibilities to control growing degree days (GDD) via Biomass Viewer graph allow growers to strategically prepare crop management from planting to harvesting. Satellite images – from right to left – show crop development from planting (right-pink images with low LAI), to maturity with the highest LAI accumulation (middle-dark-green images), and finally harvesting on the left side.
- Identify regional variances in growth status: within one cropzone, growers can identify areas below or above the average of biomass development via data zonation; resulting in instant actions and local management.
- Optimize biomass development based on field variabilities to uniformly reach maximum LAI and, consequently, enhance yield potential.
- Action on problematic areas first.
- Allocate more devices to tackle weakest biomass spots, such as weather stations, iSCOUT® sensors, Disease model, soil improvement with iMETOS MobiLab, and many other options.
- Association with weather-related conditions: satellite imagery also shows land topography patterns such as slopes and terraced fields. Topography patterns will influence weather patterns inside the CropZone, affecting soil moisture and land heterogeneity on its turn.
- Install weather stations on relevant spots.
- Correlate satellite data with weather forecast and Disease model.
- Group historical satellite and weather data to project yield potential and optimize field management.
- Understand eroded areas and water runoff effects on yield by observing crop characteristics.
Satellite images captured from a maize crop, with terraced fields. Possibility to identify crop characteristics:
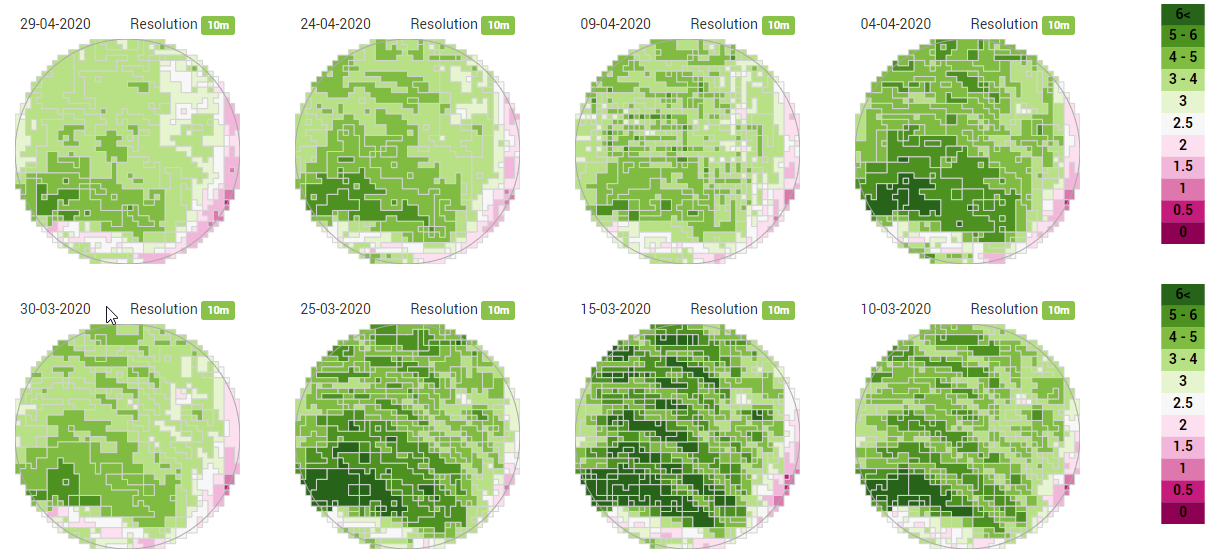
(1) Terraced structure can be seen on the line division among the crop.
(2) Spots with biomass development below growth average. For example, the Southeast border of the CropZone in a light-pink color indicates lower biomass accumulation, when compared to the rest of the crop (dark-green areas). Identify field heterogeneity, and act regionally to increase and uniform yield potential all over the CropZone, such as: soil nutrition improvement, prevent from disease infections with iSCOUT® sensors on the right spots, install weather stations with Soil Moisture module, water balance and irrigation control with Irrimet.
- Data correlation with Growing Degree Days (GDD):Growing degree days (GDD) is a weather-based indicator for assessing crop growth and development. In addition, it helps to calculate pest risks during the growing season. FieldClimate software provides GDD graphs, based on lower and upper air-temperature thresholds (under Accumulator Tool section).
- Utilize crop-coefficient-temperature thresholds to calculate adequate GDD per crop type.
- Overlap GDD data with Satellite Biomass Viewer for an overview of crop development, which directly reflects on yield potential.
- Unify vegetative phases with temperature conditions to determine the ideal dates for planting, while predicting dates of flowering and maturity.

6.2 Satellite NDVI
Also available in FarmView, the NDVI (Normalized Difference Vegetation Index) is a remote sensing index retrieved from satellite imagery. It stands for a qualitative indicator of vegetation health based on how the plant reflects light at certain frequencies (some waves are absorbed and others are reflected).
The page structure will remain the same as LAI: a graph shows NDVI development over time, mean curve, fitted curve, max and min values, in addition to cloud-status conditions.
NDVI values range from -1 to 1. Zero and below correspond to non-plant surfaces, thus focusing purely at values 0-1, which correspond to vegetated areas. The scale can be read as:
- Red tones = least vigorous crop canopy, low NDVI.
- Yellow tones = medium vigorous crop canopy, medium NDVI.
- Green tones = most vigorous crop canopy. The higher the NDVI value, the greater plant density and health.
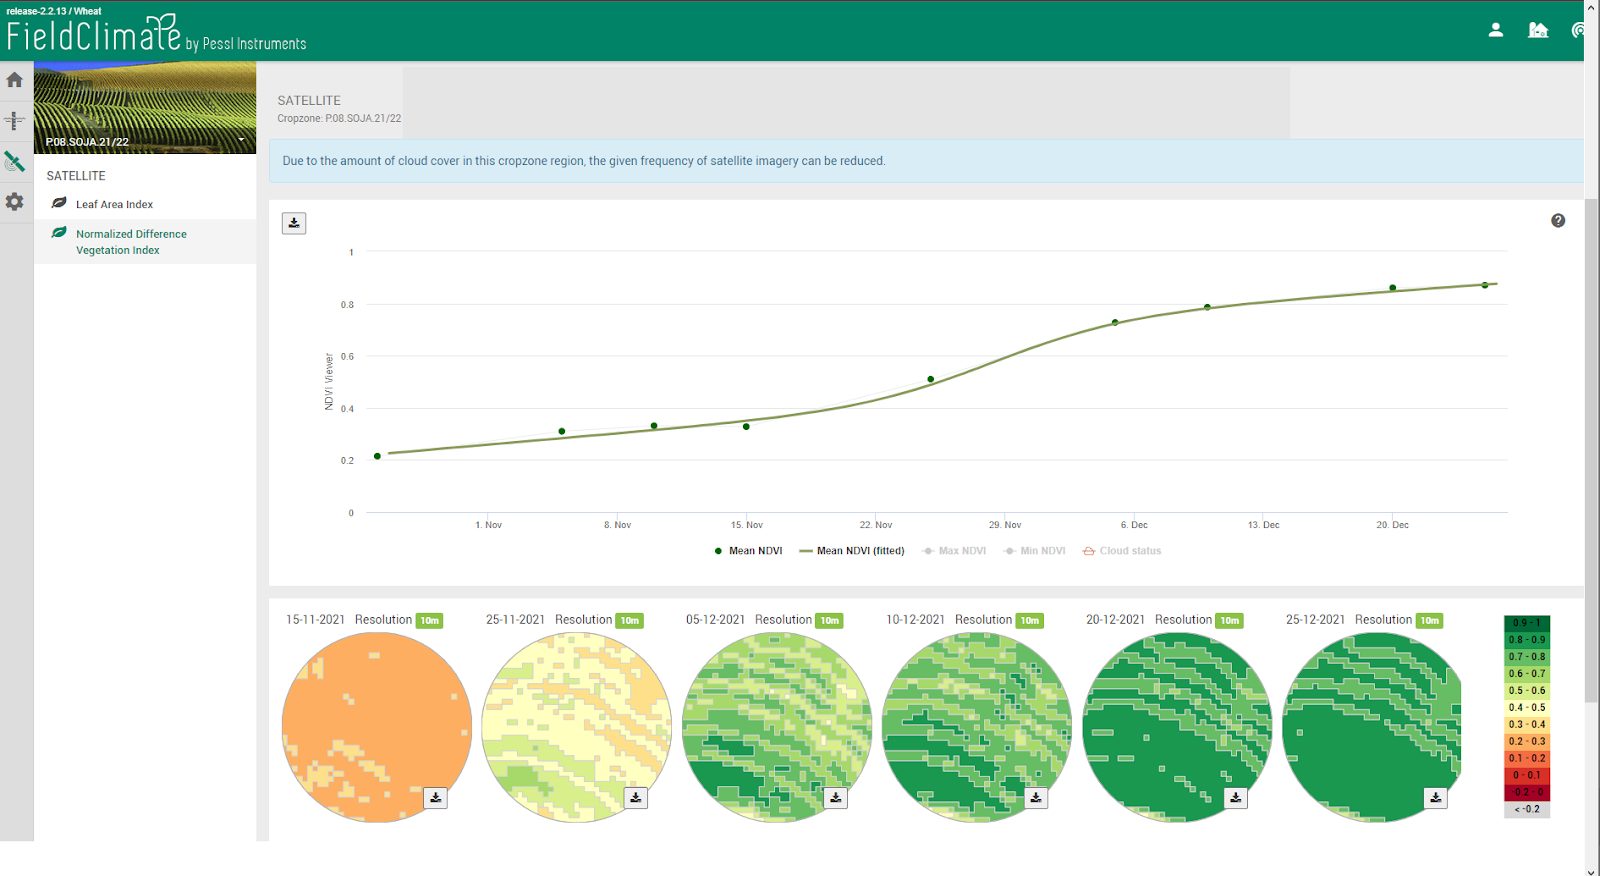
Spatial imagery is retrieved from Sentinel-2 Satellite, updated every 4-5 days. Some regions may suffer from cloud coverage which can interfere in the number of captured images thus, consequently, reducing the amount of available data. Please have a look at the ‘cloud-status tool’ to track cloudy days over your cropzone.
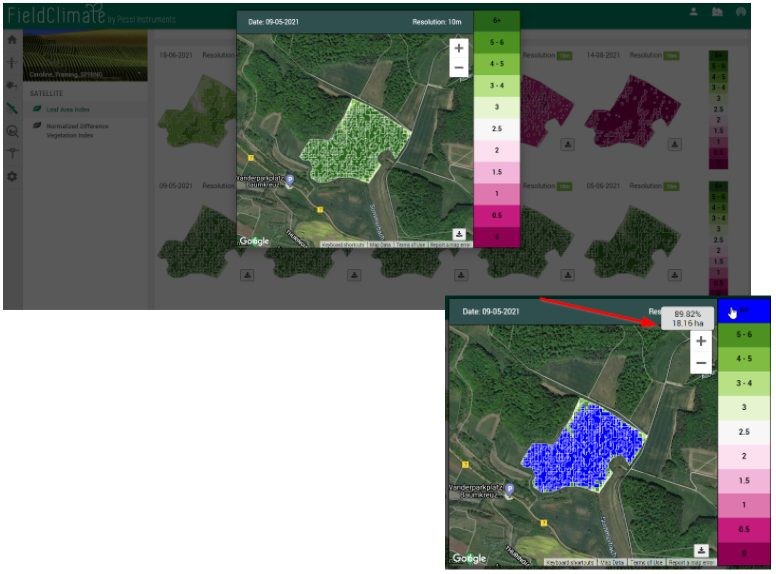
6.3 Background Map
The Satellite page contains a background map, with a satellite layer to indicate the exact location of your cropzone boundaries, filled out with the provided satellite indexes (LAI and NDVI). The map can be found when clicking on the individual imagery data.
This feature allows users to visualize, at a glance, the location of the cropzone polygon together with the stage of crop development given by the remote sensing spatial imagery. When clicking on the scale (LAI or NDVI), the pixels will be automatically populated with their respective percentage.
7. CROPZONE SAMPLING-DATA VISUALIZATION PAGES
7.1 SoilGuard Cropzone page
After uploading the SoilGuard data on your PC, via User menu -> data upload -> CSV file upload, you will be able to visualize your SoilGuard sampling data. Files can only be imported in CSV format.

The data consists of the geolocations of all samples on the map, with a raw-data table down the page. In order to see the accurate location, don’t forget to switch on your GPS location on the SoilGuard device before starting with sampling collection, in the field.
The selected sample (violet) can be chosen at any time. The respective measurements will be shown in the raw-data table, highlighted in blue. The cropzone boundaries will be shown in red.
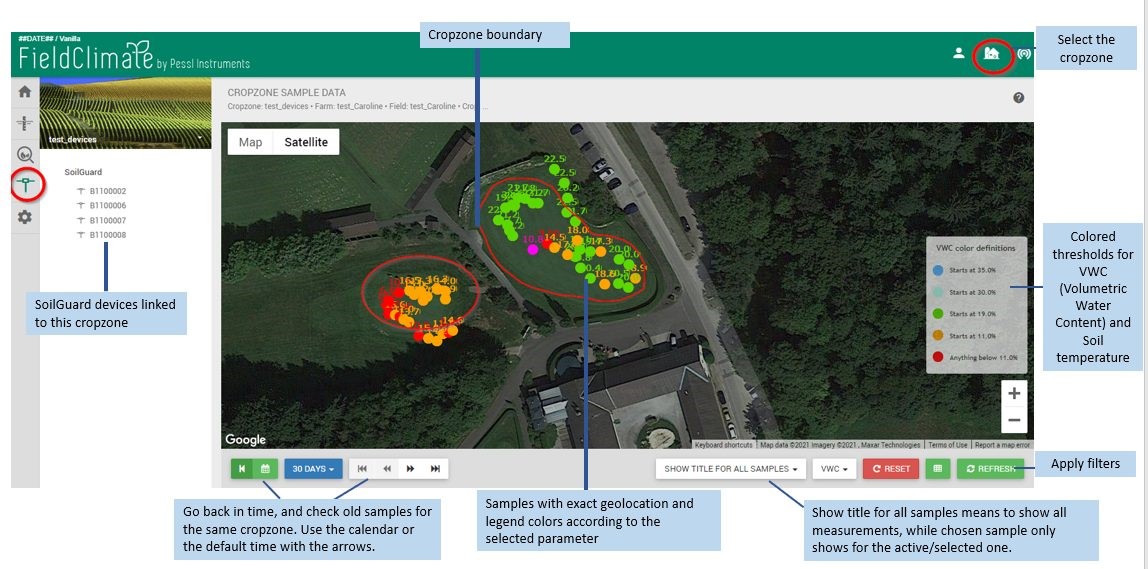
Below the map, there is a raw-data table with all measurements collected within this cropzone showing: date, VWC% (Volumetric Water Content), EC, Soil Temperature, coordinates.

7.2 Nutrition Cropzone page
Within the Nutrition Cropzone page you can visualize data for Dualex and Mobilab devices. For Dualex, data uploading can be done through User menu -> data upload -> CSV file upload.

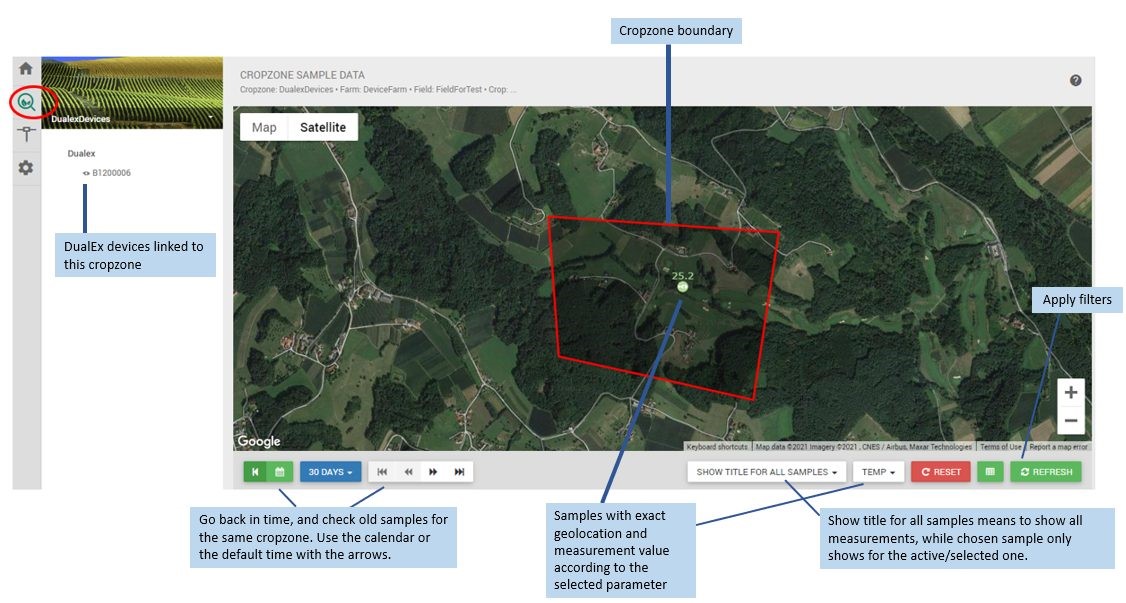
In the same nutrition page, users can also see MobiLab data.
7.2.1 How to upload data from MobiLab?
MobiLab data can be uploaded via the mobile app: MobiLab Sampler available for Android and iOS version. Step-by-step is below:
- Download the MobiLab app for iOS or Android.
- Register your sample locations on the app, respectively creating individual IDs for each one of them.
- Download the Desktop Software from Mobilab on your computer.
- Within the Desktop Software, execute the measurements for soil or Plant SAP.
- Results will appear on the Desktop Software. For more information, visit our Mobilab manual
- To visualize data in the FieldClimate platform, users need to sync data from Desktop Software to the FieldClimate server.
7.2.2 How to visualize MobiLab data in FieldClimate?
After the data sync is done, MobiLab data can be accessed via station list or via cropzone list in case of FarmView users. For the second option, data display will look this:

