
Weather – It’s The Variability That’s Hard To Farm With
PART III - CROP HEALTH
Author: Guy Ash, Global Training Manager, Pessl Instruments
In Part I of our Weather – It’s The Variability That’s Hard To Farm With series, we discussed the critical role that localized weather data and precipitation play in effective farm management. Part II shifted focus to another crucial weather variable – temperature, and how it impacts crop growth and farm operations.
Now, in Part III, we explore the influence of relative humidity and leaf wetness on disease pressure, spraying operations (Delta T), and overall crop management. Additionally, we examine wind speed, direction, and gusts, shedding light on their impact on spraying efficiency, lodging risk, and drying conditions. The key takeaway? Understanding these microclimatic factors through site-specific weather monitoring is essential for making informed decisions and safeguarding crop health.

RELATIVE HUMIDITY AND LEAF WETNESS: impacts disease pressure/risk, spraying operations (Delta T)
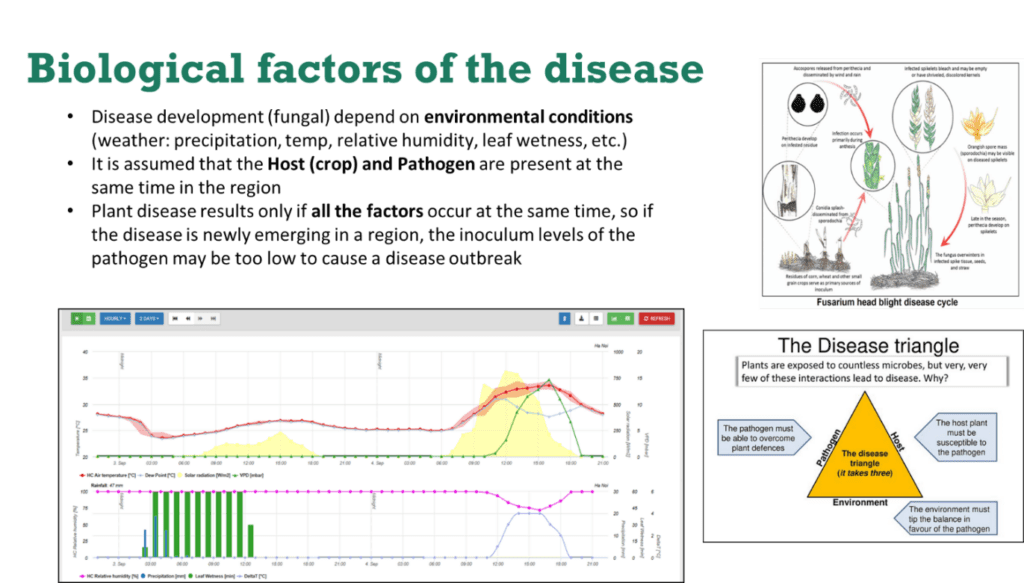
Relative humidity (%), as the name implies, is relative to the air temperature. A volume of air at 30 °C (86 °F) will hold far more water vapor than air at 10 °C (50°F), hence the term of relative humidity. Relative humidity values over 95% are typically used in disease models to predict infection conditions. Leaf wetness sensors mimic how a leaf will wet and dry with humid and wet conditions. This is used to look at periods of time when the leaves are wet, which is used in disease model applications. Before and during rain events you will see the leaf wetness values become active.
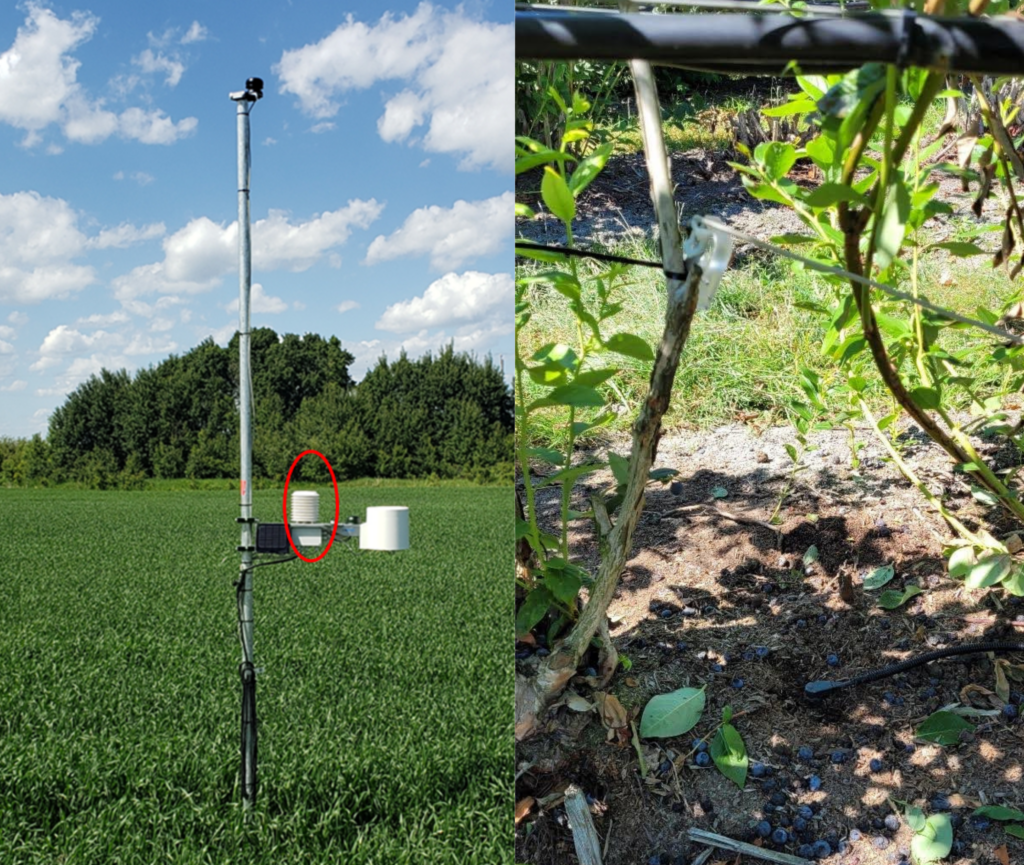
Placement of the leaf wetness in the crop canopy is critical since it mimics the wetting and drying of a leaf. In a thick canopy, a microclimate of warm, humid conditions exists, which drives the environmental conditions for disease development. If it’s placed outside the canopy, then the periods of leaf wetness will be less. Relative humidity sensors are typically part of the air temperature sensor and installed 1.5 meters or about 4 ½ feet.
HOW DOES RELATIVE HUMIDITY OR LEAF WETNESS IMPACT CROP MANAGEMENT?
Relative humidity and leaf wetness vary greatly over a small spatial distance because of the nature of precipitation events and the type/thickness of crop canopy. As discussed above relative humidity is important in the calculation of Delta T for spray applications. In addition, site-specific relative humidity and leaf wetness is very important in the prediction of disease pressure or risk for various crops.
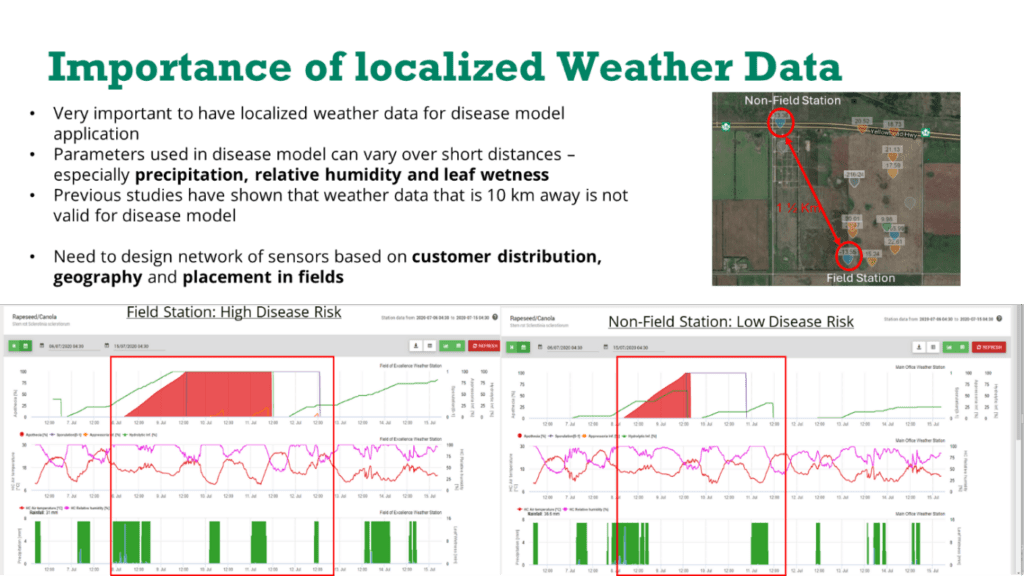
Most crop disease models use time periods of various relative humidity levels (%) or leaf wetness periods (minutes) in relationship to temperatures. Simply put, crop diseases require the right environmental conditions to develop into an epidemic, hence the need for site-specific measurements. The illustrations below clearly show that a weather station that isn’t in the field, will not reflect the actual conditions for disease pressure/risk. The two stations are only 1 ½ km or 1 mile apart (one in the field, the other under grass) with the field station showing long infection events with high pressure/risk. These differences were further confirmed with an on-farm case study of Fusarium in wheat, where the field IoT device predicted a higher risk than the government station that was 10’s of km away. It’s not that the models are different, just that the data from the field reflects the actual conditions.
Cost of FHB Damage: With fusarium head blight (FHB) disease severity levels varying between 0.5%, 1.2% and 2.2%, downgrading of Canadian Western Red Spring (CWRS) from #1 to #2 or #1 to #3 or #1 to feed on a 55-bushel acre crop has resulted in $12, $35, and $100 of lost farm income per acre in Western Canada.
WIND SPEED/DIRECTION AND GUSTS: impacts spray operations, lodging, drying conditions, evapotranspiration
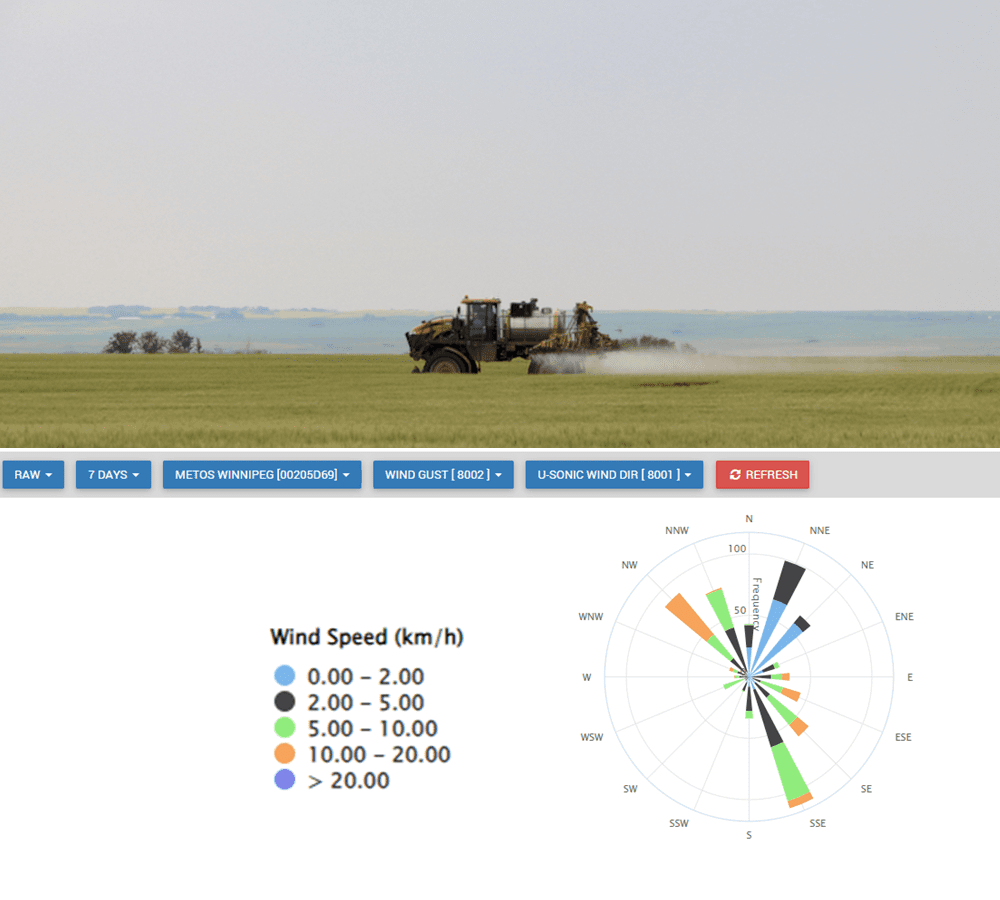
Wind speed, gust and direction are usually shown in kmh or mph and degrees or cardinal directions (e.g., northeast). In spray operations, wind direction determines whether droplets travel toward the target or toward unintended downwind areas such as open water, sensitive crops, or areas of human activity. Wind speed affects the distance a droplet will travel before it is deposited on the target – deposition.
Wind speed/direction is always used in conjunction with Delt T for spray applications, by using the in-field weather station and a field specific forecast:
- Spray only when wind direction is consistent for the attended target and between 2–20 kmh (1 to <12 mph), or as indicated on the product label.
- The impact of wind is particularly significant when performing directed (e.g. airblast) spraying, so spray with a crosswind and always orient nozzles and deflectors to direct the spray into canopies, not over them.
Spray can be applied at the high end of a spray scale by using:
- drift-mitigating nozzles
- larger droplets
- slower forward speeds
- shrouds or deflectors and/or
- reducing the distance to the target – height of nozzle
Cost of Spraying inefficiencies: Pesticide efficacy varies depending on weather conditions from 20 to 100%. Pesticide efficacy can reduce quality by up to 80% & yield by up to 30%.
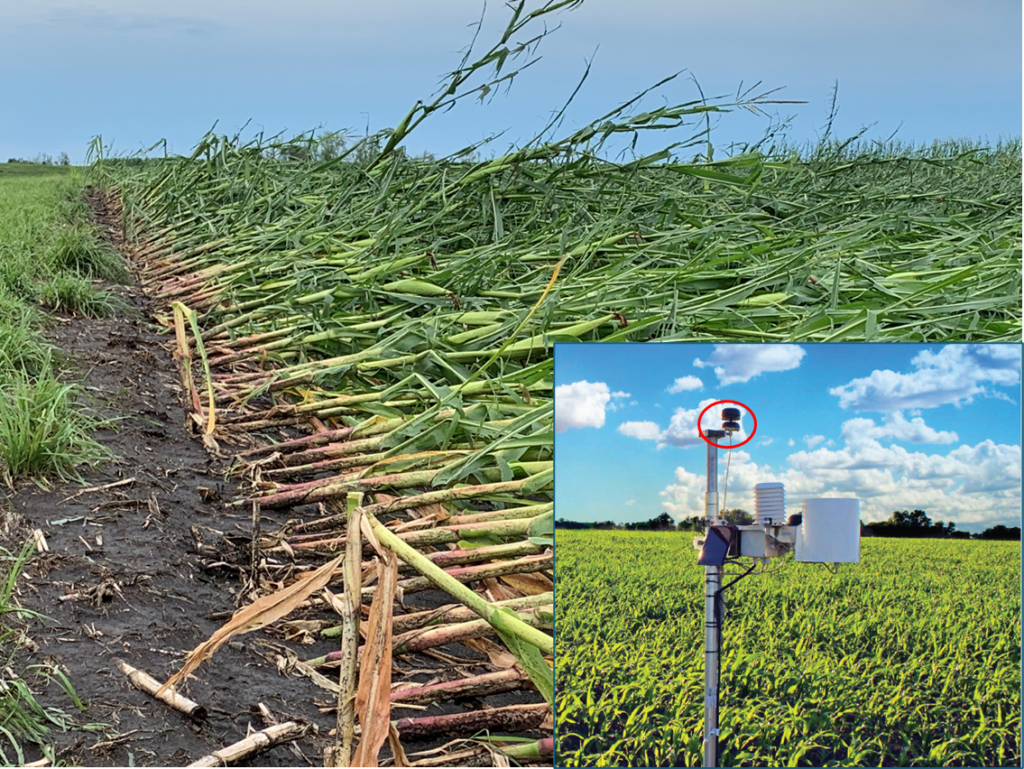
Strong winds and wind gusts can cause significant lodging in crops, which depending on the timing, can reduce yields, increase harvest and drying costs and downgrade quality.
Lodging is caused by a combination of factors, such as nutrition levels, stage of development, amounts of rainfall/saturated soils and of course wind speed/gusts
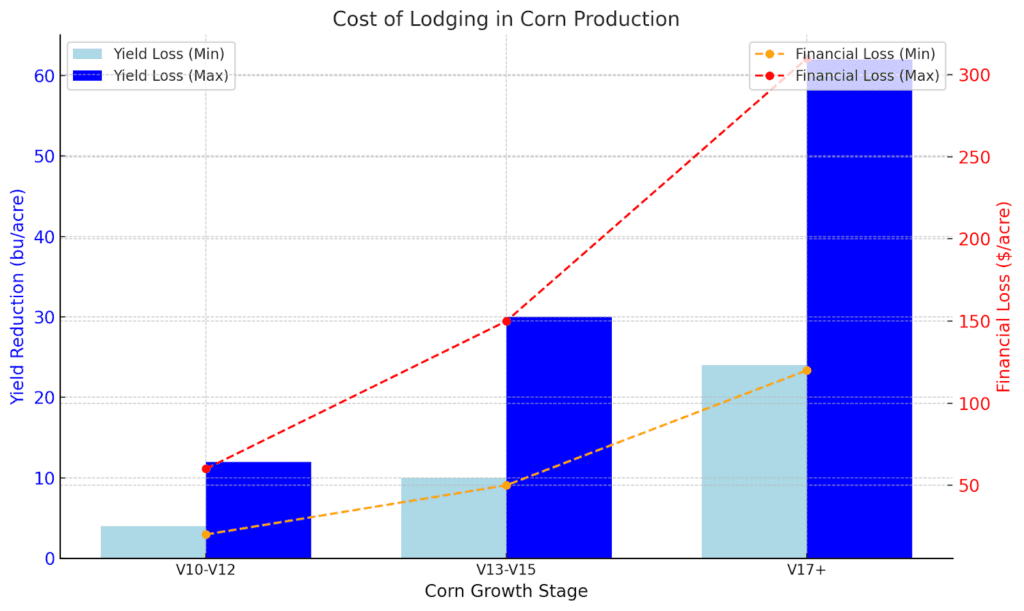
Cost of Lodging in Corn Production: Previous research has found that lodged corn plants could have yield reductions of 2-6% during the V10-12 stage, 5-15% through the V13-15 stage), and 12-31% from V17 and later. On a 200 bu/acre corn this translates into 4 to 12 bu/acre in the first stages, 10 to 30 bu/acre through V13 – V15 and 24 to 62 bu/acre after V17. At $5 bu corn the losses range from $20 to $310 bu/acre.
KEY TAKEAWAYS FROM PART III
Precision agriculture depends on accurate, site-specific weather data. From disease pressure predictions to efficient spraying operations and reducing lodging risks, having a real-time understanding of relative humidity, leaf wetness, and wind conditions can significantly improve farm productivity. Weather stations and IoT devices placed within the field provide a more realistic picture than distant government stations, ensuring better disease risk assessment and more effective interventions. By leveraging this data, farmers can protect yields, optimize inputs, and increase profitability despite the unpredictability of weather.
Enjoyed this?
Make sure not to miss PART IV that’s coming out next week. Subscribe now and be the first to read it.