We all love surprises, right?... NOT always. Make sure the weather can't surprise you.
What Do You Get with METOS®
Site-Specific Forecast and Weather Maps?
We all know the benefits of a site-specific field weather station or IoT device and how they can reduce the “uncontrollable risk” that farmers face, based on the weather to date, but it’s only half of the weather solution.
The other part is the forecast. Yes, the future impacts of weather on the field are as important, if not more important, as the conditions up to date.
Site-specific Forecast and Weather Maps are built for your in-field device
What does this mean?
- Each device contributes sensor data to adjust and tune the forecast for the specific location.
- In addition, the forecast model uses AI to “learn” the weather at your location.
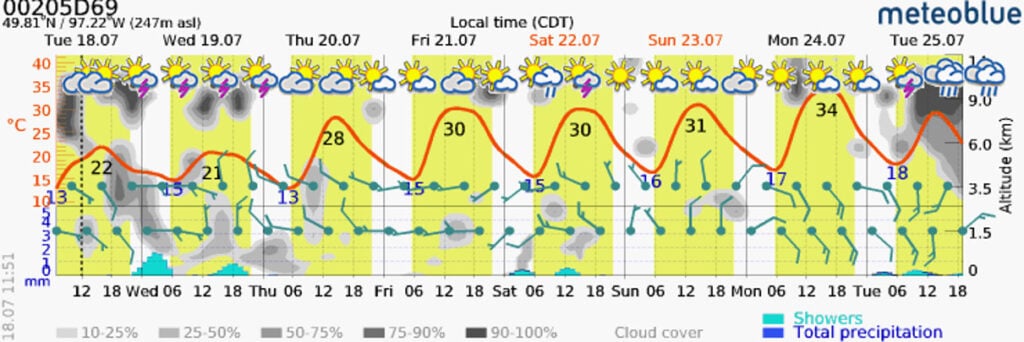
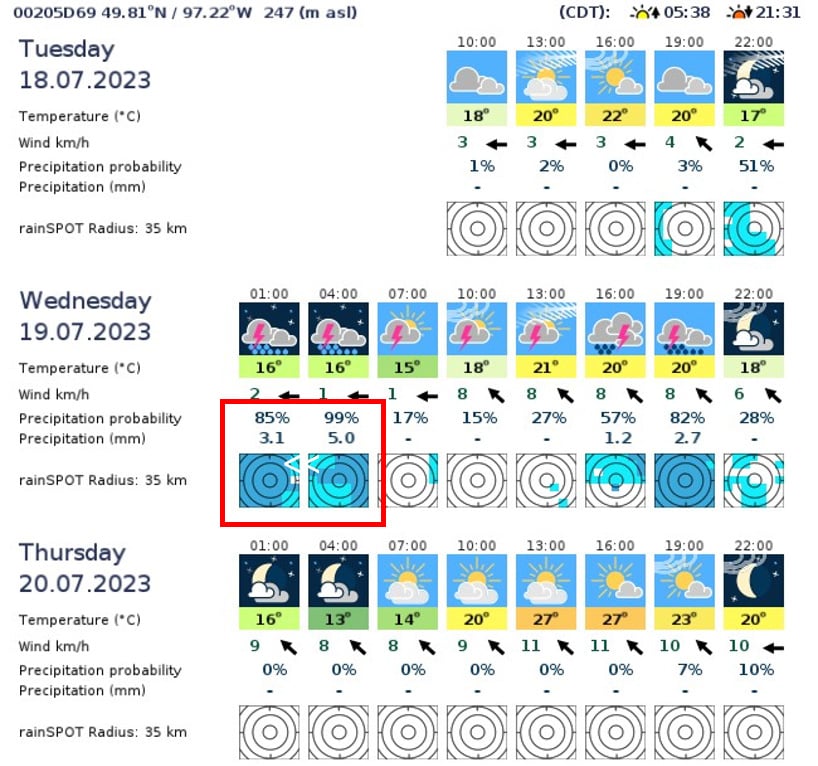
- The result is a very accurate, hourly updated site-specific forecast for the next 7 days.
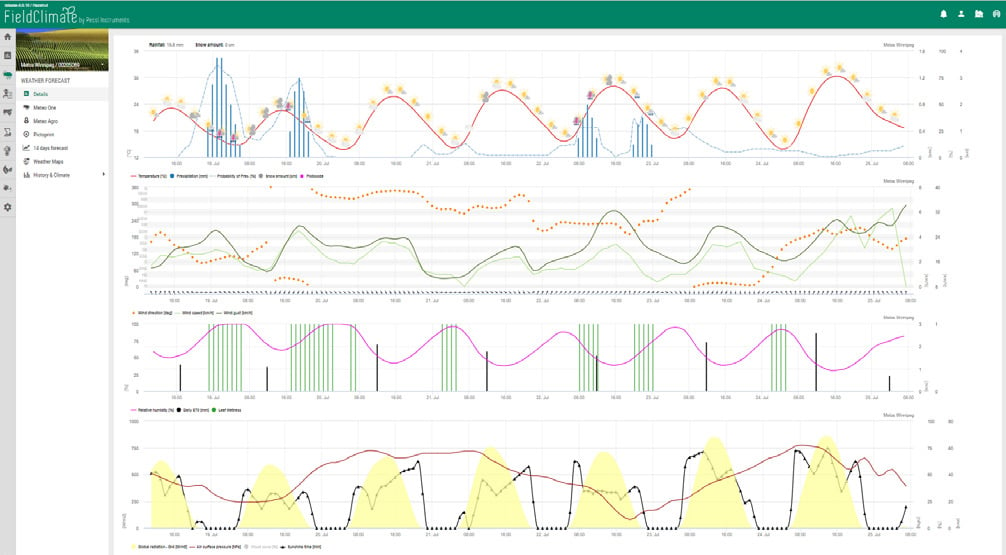
- Output variables include: temperature, probability of precipitation, precipitation amounts, time of precipitation, sky conditions, wind speed/gust and direction, relative humidity, leaf wetness, ET0, air pressure, global radiation and sunshine time.
- The forecast variables are further built into Work planning solutions.
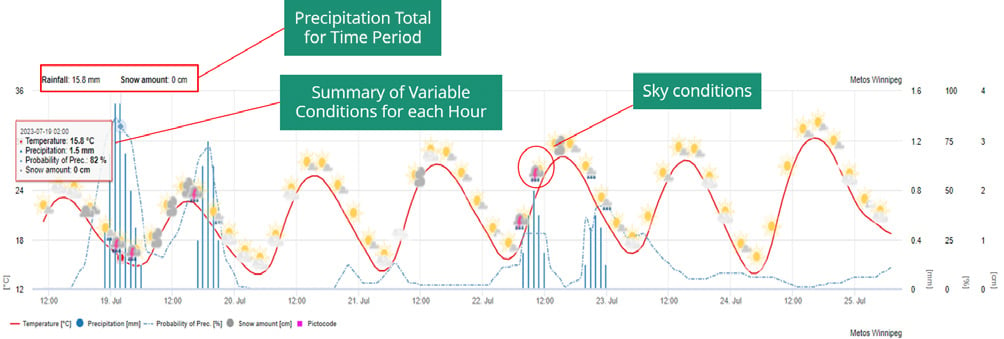
In this Forecast, the total rainfall for the 7-day, hourly forecast is 15.8 mm. Hourly rainfall amounts vary from 0.2 mm to 1.5 mm, while the probability of rainfall is as high as 85%.
In this Forecast, a good example of favorable wind conditions for spraying occurs on the morning of July 21. From about 6 am until early evening (6 pm). Winds are consistent from one direction, while wind speed and gusts are generally below 20 kph.
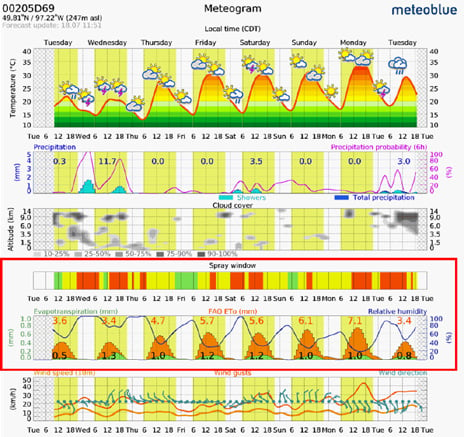
Remember: that wind speed and direction should be combined with precipitation events, and DeltaT. These can be found under Work Planning Tools: Spraying Conditions.
Weather maps
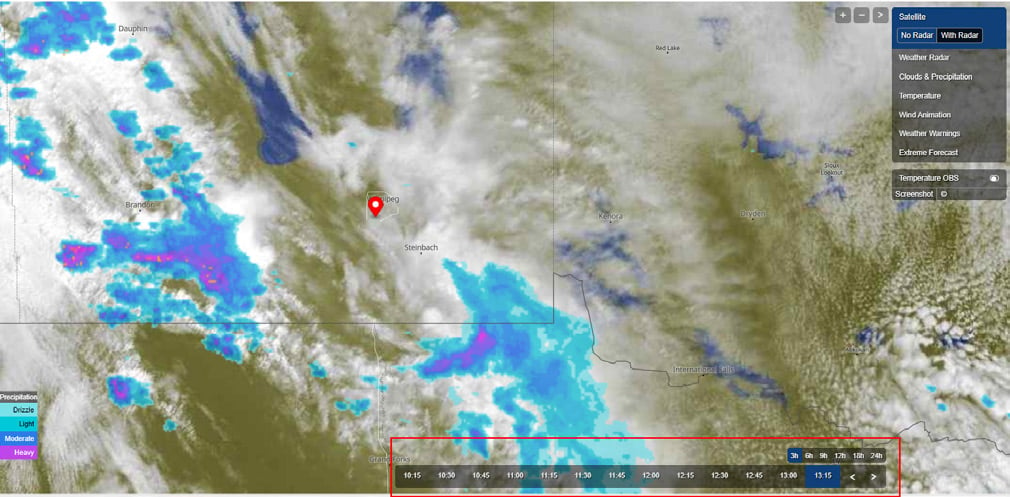
- Our satellite-radar function shows weather maps in 15-minute updates, which are then visualized in 1-minute intervals, for the last 3 hours. It is available also for time ranges of 6, 9, 12, 18 and 24 hours for worldwide locations, with animation.
- For the USA and EU, we now offer a high-resolution 1-hour and 2-hours forecast, respectively. Real-time map animation, allows the user to track movement, whether it is attenuating or intensifying (orange crosses mark places where lightning was detected).
- The location marker is based on your station location; however, the user is able to move and zoom the viewport and control the animation.
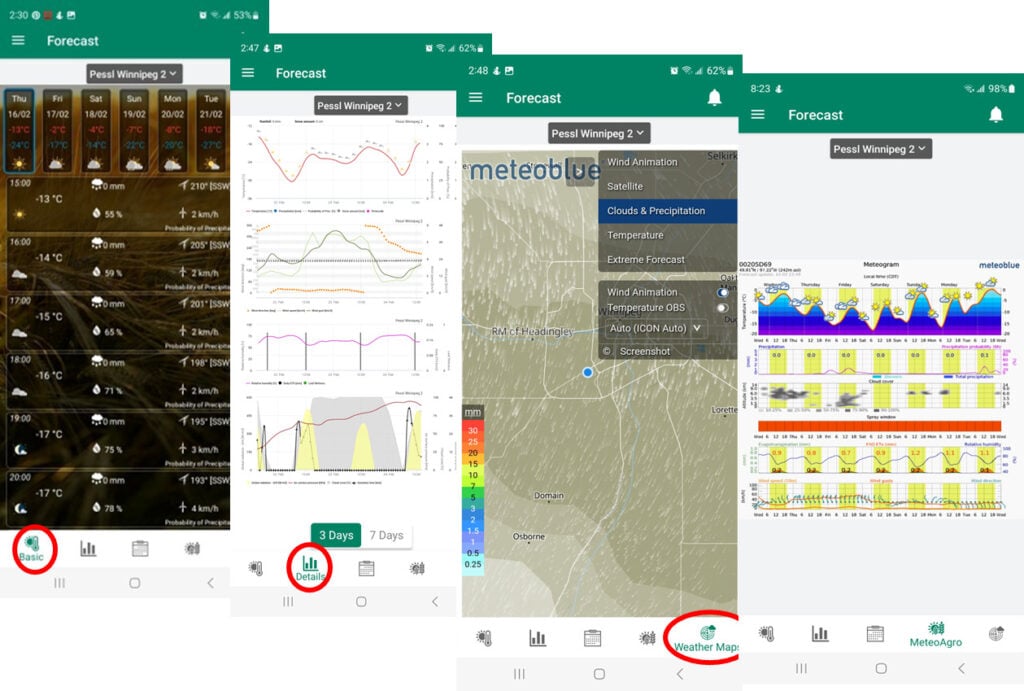
Most of the weather forecast information can also be found on your iOS/Android FieldClimate mobile app.
History & Climate – Risk Assessment
Cold events
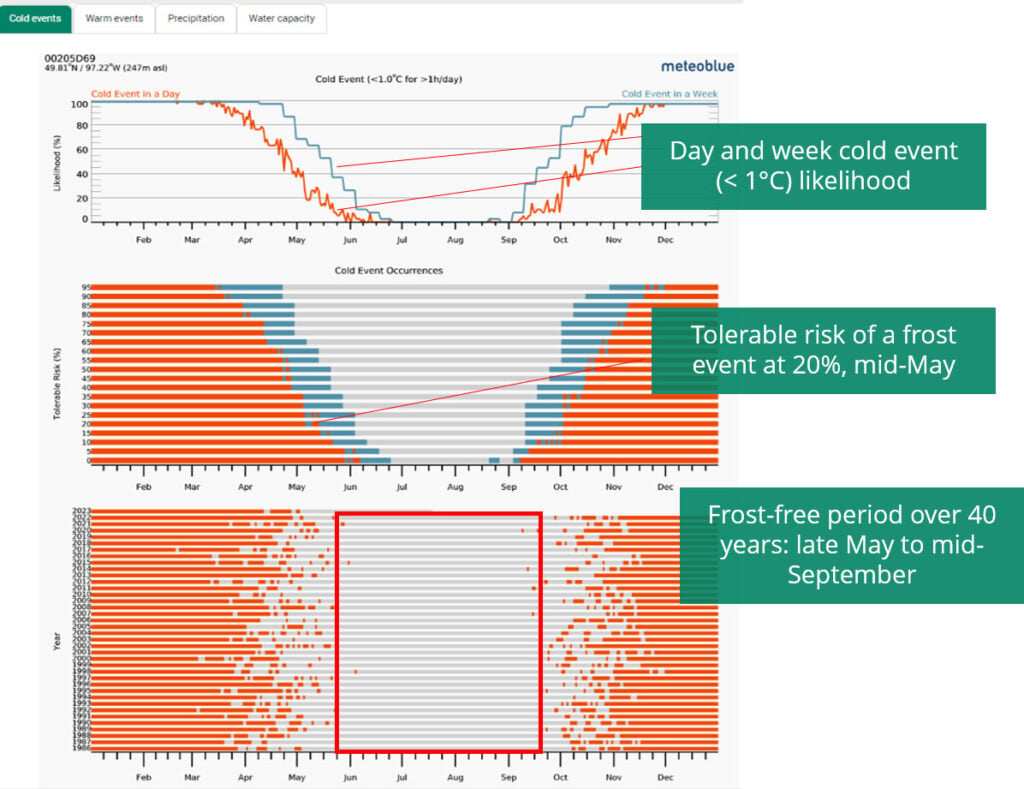
- Temperature below a certain threshold for a certain time. The threshold is set for temperature values at 1°C for cold events.
- The cold events meteogram is commonly used to evaluate frost. The first diagram shows the likelihood of the defined event.
- You can estimate your personal risk in the second diagram. For instance, if your personal tolerable risk for a frost event is 20%, you should schedule sowing later (e.g., mid-May). On the other hand, if you can accept 50% frost likelihood in favor of earlier sowing, you should sow earlier (e.g., late April).
- The last diagram shows the occurrence of the defined event in the last 40 years for each year. You can also define the duration of an event.
Warm events
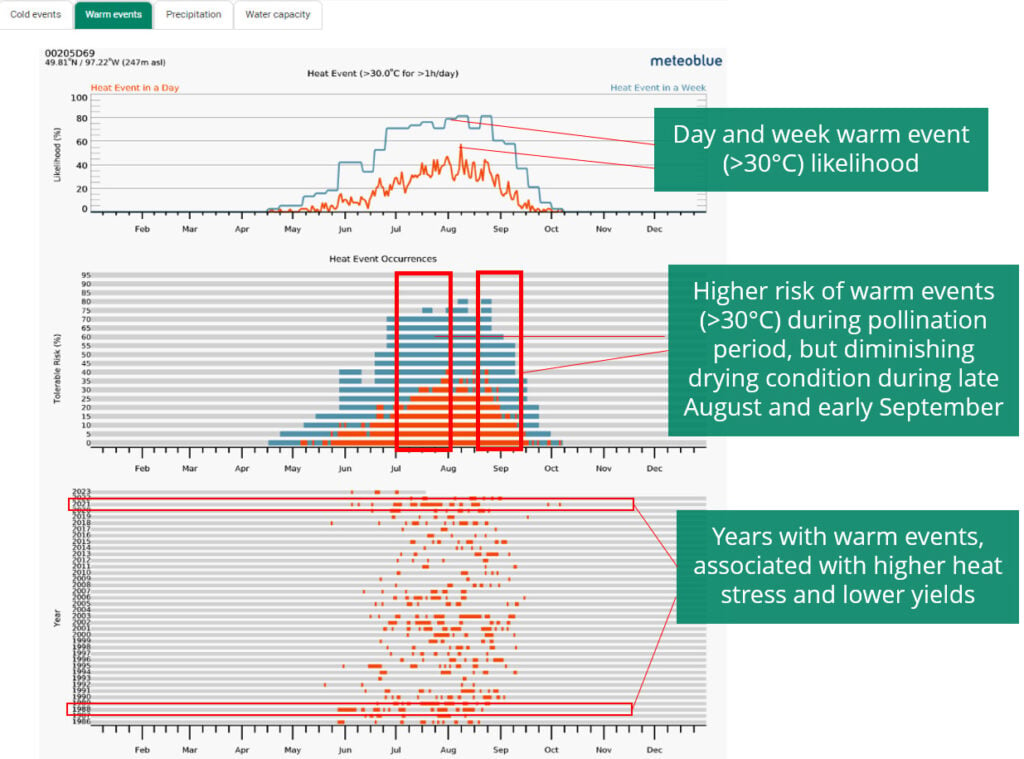
- Temperature below a certain threshold for a certain time. The threshold is set for temperature values at 30°C for warm events.
- The warm events meteogram is commonly used to evaluate heat stress. The first diagram shows the likelihood of the defined event for the day and week.
- The second diagram provides a chart of tolerable risk: the risk as a % for the day or week, over the year, of temperature >30 °C.
- The last diagram shows the occurrence of the defined event in the last 40 years for each year. You can also see the duration of an event.
Precipitation events
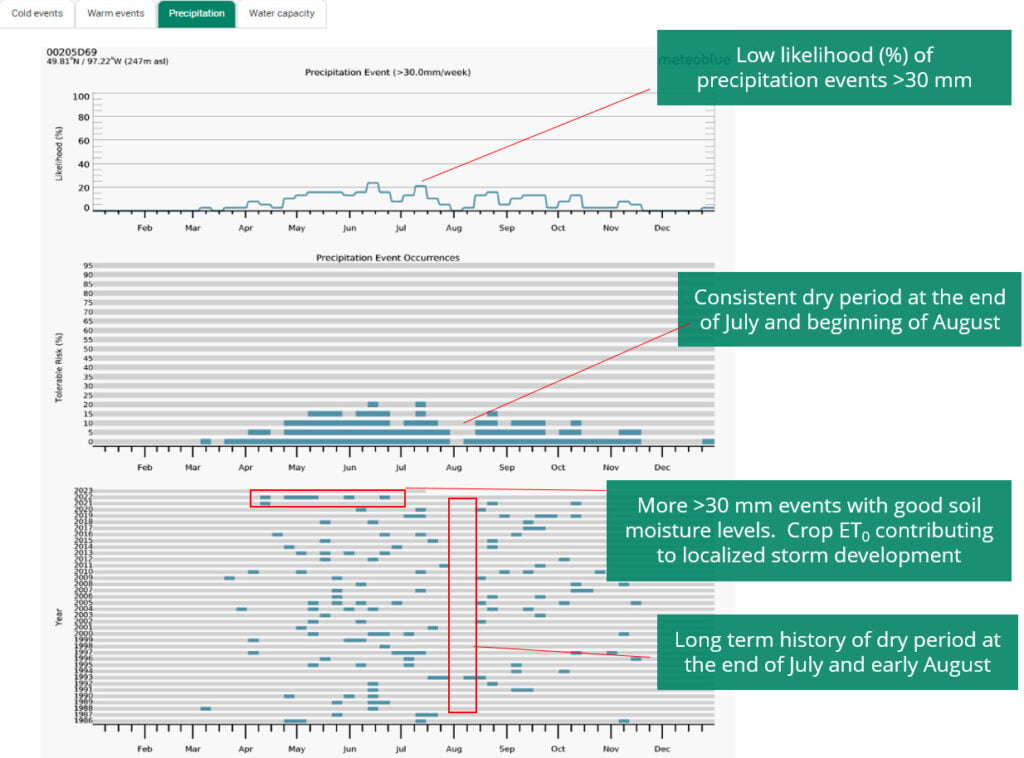
- This variable evaluates precipitation amounts in a week above a certain threshold and with the help of this representation, you can estimate strong precipitation events and schedule activities accordingly.
- The threshold for precipitation amounts is set at 30 mm/week.
Water capacity
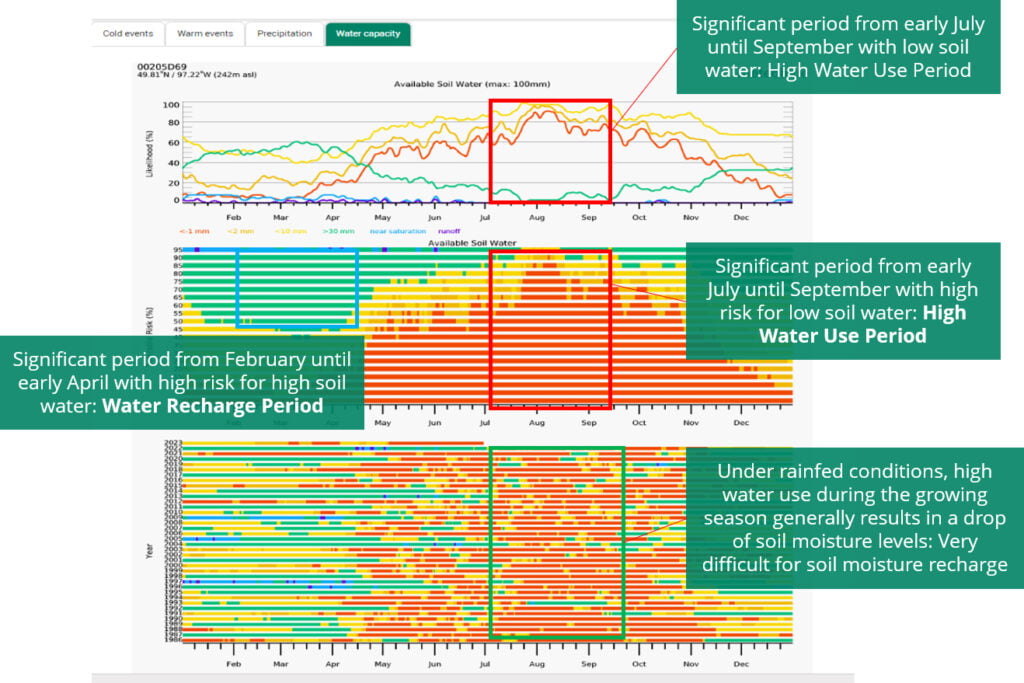
- New sub-page with historical data for estimated probability of remaining soil water amount.
- Categories: <1mm, <2mm, <10mm, >30mm, near saturation and runoff.
Benefits
- Know before you go – save time and money
- Site specific forecast for your fields
- Hourly update forecasts
- Output data for multiple forecast variables
- Actionable forecast tools: e.g., Spraying window
- Localized weather maps, radar and forecast risk
- Station-specific history & climate risk assessment and climate comparison
Don’t have a station yet?
Already a user?
Want to learn more?
Download the brochure with much more detailed information and even greater amount of pictures.
