USE CASE: In-Field Yield Prediction at EMILI and Innovations Farms
Verim ne olacak?
This is perhaps the most thought about question throughout the growing season, and as the song goes by Luke Bryan “rain is a good thing, it makes grain (corn)”. In dryland agriculture, yield comes down to two important environmental factors: water supply and thermal development, with the water supply by far the most important variable. Of course, the proper field management techniques are critical (fertility, weeds, disease, and insect management), but if you don’t have good environmental conditions, all the field management may not be possible.


The first figure below illustrates corn growth stages, water-use curve by growth stage, root depth by growth stage, and water-use by root depth. As stated above, the importance of water supply is clearly illustrated, where, with warm to hot temperatures, up to 9 mm or over 1/3 inch of water can be used each day. In one week, this is 2 ½ inches or 63 mm of water required. To put this another way, this requirement of water used must be met by soil moisture, irrigation, and/or precipitation to maintain optimum growth, and if not, there is the potential for moisture stress and reduced yield.


We’ve previously talked about the METOS® Verim Tahmini solution in Çiftlik Hava Durumu Konuşması #003 - Verim Tahmini, Çiftlik Hava Durumu Konuşması #007 - Sezon İçi Verim Potansiyelim Nedir?ve Smart Farming in Action: Validating METOS® Olds, Kanada'da Buğday Verim Tahmini but further field tested the METOS® Yield Prediction solution for corn, at EMILI and Innovation Farms (grower farm) for the 2023 growing season.
EMILI and Innovation Farms
AgExpert tarafından desteklenen İnovasyon Çiftlikleri, ticari bir tohum çiftliği (Rutherford Farms) boyunca uzanan 5.500 dönümlük bir alandır ve yenilikçilerin yeni teknolojileri ve uygulamaları test etmesine, doğrulamasına ve göstermesine olanak tanır.
Innovation Farms, çiftçilerin karşılaştığı çeşitli tarımsal ve teknolojik kısıtlamalara ve fırsatlara uygulanabilir çözümler geliştirmek için endüstri ve akademi dünyasındaki yenilikçilere en son ekipman, teknoloji ve üretim uygulamalarına erişim sağlar.
In one of their many trials at EMILI and Innovations Farms, the Verim Tahmini and satellite solution for corn were tested on a field scale.
Field Trial at EMILI
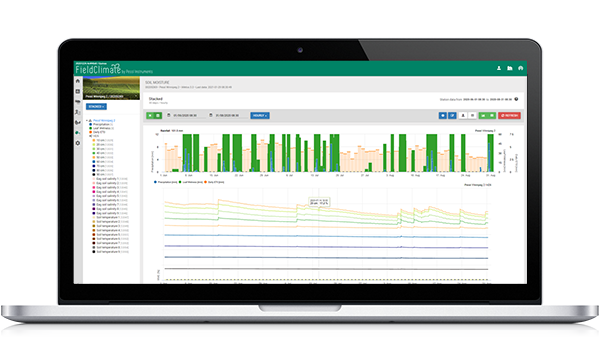
The hybrid used in this study was North Star 271, which is rated as very good for drought tolerance. The Yield Prediction and satellite solution were setup for a field-scale evaluation, as highlighted in the image below. The user can either digitize the cropzone or field boundary manually or import a geojson or shape file.


The next step is to customize the cropzone of the field settings. In the first box below, Maize was selected with a sowing date of May 11, 2023, and an expected harvest date of September 30, 2023. The second red box deals with fine-tuning the maturity date and yield expectations. This allows the user to adjust for different maturity group ratings and expectations in their region. The yield adjustment also allows the user to fine-tune individual variety yield differences and expectations for their region. Here, an average maturity date of September 27, 2023, was set, with an average yield expectation of 152 bu/acre. In the third box, there are a number of important settings.
- Best possible average yields: In a very good year (optimal water conditions, no pests or diseases), how high could your yield realistically be? In the Yield Prediction graph, this will cut off the prediction (upper limit). This was set at 150 bu/acre.
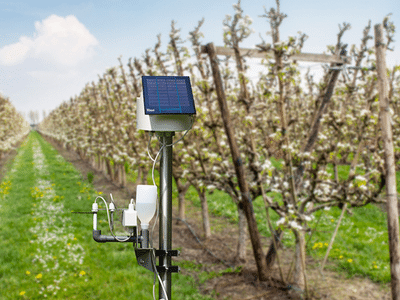
- Air temperature and rain source: The yield predictor requires a temperature and rain sensor installed near the cropzone (10 km / 6 mi radius). At least one of the selected stations must have an active Weather Forecast license, since Yield Prediction uses seasonal weather forecasts and historical weather data. It’s preferred to have the rain source in the field, since this is very important for the Yield Prediction calculation. In this case, the rain measurement was from the actual field, while the temperature and forecast were from a station 6 km from the field.
- Soil texture: Select the prevailing soil texture within your cropzone. The list is based on USDA soil texture classification or defined based on your own custom soil texture results. This was set to custom since a field-installed soil moisture probe helped define the values of field capacity and wilting point. These were set to 57 and 23, respectively.
- Initial soil moisture: The yield predictor needs an estimate of the actual available soil water at sowing. You can use your experience here; how much precipitation did you observe prior to sowing? You can also check the precipitation measurements of your nearest station. You can also use a local soil moisture probe to make an estimate of the amount of water in a 1 meter or 3.3-foot rooting depth. This was set to full based on the observations from the soil moisture probe (see Fig. 4).


What was learned this year?
The collection of field-level weather data is critical: It is very important to have localized weather data for the Yield Prediction solution to work optimally. Since yield is influenced by soil moisture, which is determined by rainfall, it is highly recommended that an automated rain bucket be installed at the field. The random nature of rainfall events from localized showers and thunderstorms drives this field-to-field variability. The temperature measure can also be taken from the field station, but is not as variable as the rainfall measurements, so this can be from another station within a 10 km radius.
Four IoT devices measuring precipitation were compared and were all within 6 to 10 km apart. The IoT device located right at the corn field had a total of about 162 mm of precipitation from May 2 to September 2, which is well below the long-term normal of 312mm. The IoT device just to the west of the field (about 6 km) had 169 mm for the same period, while the IoT device further west (about 10 km) had 234 mm and one southwest of the field (about 8km) had 200mm. Furthermore, 73 mm of the 162 mm (~45%) at the field IoT device fell during July, a critical time for pollination and cob fill.
This clearly illustrates the large spatial variability in precipitation (72 mm between the IoT devices used in this study) on the Canadian Prairies and the need for in-field IoT devices for Yield Prediction or any crop analysis. To put it another way, the difference in rainfall totals equates to about a 15 to 30 bu/acre difference in corn yield.
Peki sonuçlar nedir?
Bunları yeni broşürde okuyun aşağıda.
Do you want to know what your field’s yield potential is?
Daha fazlasını öğrenmek ister misiniz?
İndirin In-Field Yield Prediction at EMILI and Innovations Farms Broşür.


